Dow sank 88, decliners over advancers almost 4-1 & NAZ fell 32 (even high flyer Apple was down). The Financial Index fell 1+ to the 185s, lowest level since the start of 2012.
The MLP index fell another big 5+ to the 363s (a 6 month low) & the REIT index was off 1+ to the 245s. Junk bond funds were mixed & Treasuries rose, pushing 10-year yields to record lows for a 2nd day, on concern the European debt crisis is widening & a slowdown in US economic expansion. Oil was poised to cap the biggest monthly drop in more than 3 years on speculation that slowing US economic growth & Europe’s debt crisis will reduce fuel demand. Gold is on track to have its worst run of monthly losses in more than 11 years as concern that Europe’s fiscal crisis drove investors to seek the dollar as a haven over the precious metal.


Photo: Bloomberg
The number applying for unemployment payments rose last week to a one-month high, signalling that progress in reducing joblessness may be stalling. First-time claims rose 10K to 383K last week from a revised 373K in the prior week according to the Labor Dept & was above the estimate of 370K. Estimates ranged from 364K- 377K. The number of people on unemployment benefit rolls dropped. The prior week’s applications were initially reported at 370K. Last week’s claims were the highest since 392K in late Apr. The 4-week moving average rose to 374K from 370K. The number continuing to collect benefits dropped 36K to 3.24M but that does not include workers receiving extended benefits under federal programs. The unemployment rate among those eligible for benefits held at 2.6%. 34 states & territories reported an increase in claims, while 19 reported a decrease. Another weak jobless claims report is not encouraging before tomorrow's jobs report for May.
Jobless Claims in U.S. Increased by 10,000 to 383,000
The US economy grew at an annual rate of 1.9% in Q1, slower than first estimated (2.2%) according to the Commerce Dept. The downward revision was largely because consumers & govs spent less than first estimated, businesses restocked more slowly & the trade deficit grew sharply. Analysts project the economy is growing at a slightly faster rate in Q2, 2-2½%, & some expect the economy will maintain that pace for all of 2012, an improvement from last year's 1.7% growth. Still, growth of 2.5% is typically enough just to keep pace with population changes. It takes almost twice as much growth to lower the unemployment rate by 1 percentage point over a year. A rising trade deficit slows growth because the country is spending more on foreign-made products than it is taking in from sales of US made goods. Less restocking means companies ordered fewer goods, which decreases factory production & weighs on growth. Consumer spending grew at an annual rate of 2.7% in Q1. While the fastest pace since the end of 2010, it was down from an initial estimate of 2.9%, largely because of fewer auto purchases. Gov spending at all levels fell at a 3.9% annual rate, much more than the 3.0% decline first estimated. It was the 6th straight qtr that gov spending has declined, reflecting budget constraints at the federal, state & local levels. Growth is expected to pick up slightly this spring because of job growth & lower gas prices, allowing consumers to spend more freely. The economic recovery continues to plod along.
Economy in U.S. Expanded Less Than Previously Estimated
Business activity in the US expanded in May at the slowest pace in more than 2 years as orders & production cooled. The Institute for Supply Management said today its gauge decreased to 52.7, the lowest since Sep 2009, from 56.2 in Apr (readings greater than 50 signal growth). Expectations were for a rise to 56.8. While demand for automobiles continues to fuel factory output, the debt crisis in Europe & a slowdown in China may cause some businesses to cut back on spending & hiring. It;s clear, the economy is not charging ahead on all cylinders.
Business Activity in U.S. Unexpectedly Grew at Slower Pace
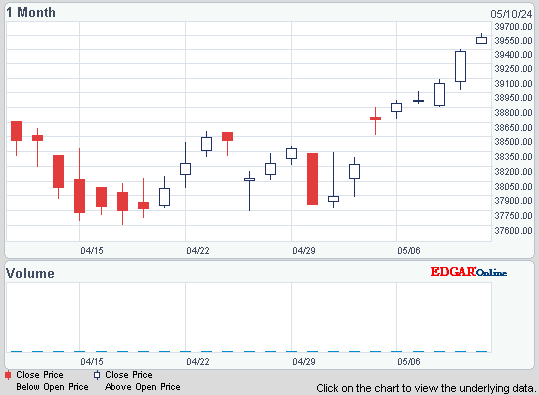
A dreary day is closing a dreary month. The chart below says it all. Dow is up a measly 125 YTD, not what all those experts had in mind at the start of 2012. Interesting that Apple (AAPL) & Facebook) (FB), both with large market caps & sexy, growth images, are sputtering. The jobs report tomorrow is expected to show a gain of 150K jobs & there is a good chance that the data will disappoint.

The MLP index fell another big 5+ to the 363s (a 6 month low) & the REIT index was off 1+ to the 245s. Junk bond funds were mixed & Treasuries rose, pushing 10-year yields to record lows for a 2nd day, on concern the European debt crisis is widening & a slowdown in US economic expansion. Oil was poised to cap the biggest monthly drop in more than 3 years on speculation that slowing US economic growth & Europe’s debt crisis will reduce fuel demand. Gold is on track to have its worst run of monthly losses in more than 11 years as concern that Europe’s fiscal crisis drove investors to seek the dollar as a haven over the precious metal.
JPMorgan Chase Capital XVI (AMJ)
Treasury yields:
U.S. 3-month | 0.056% | |
U.S. 2-year | 0.258% | |
U.S. 10-year | 1.576% |
| CLN12.NYM | ....Crude Oil Jul 12 | ...87.71 | .... | (0.1%) |
| GCM12.CMX | ...Gold Jun 12 | ....1,568.20 | ... | (0.3%) |
Get the latest daily market update below:

The number applying for unemployment payments rose last week to a one-month high, signalling that progress in reducing joblessness may be stalling. First-time claims rose 10K to 383K last week from a revised 373K in the prior week according to the Labor Dept & was above the estimate of 370K. Estimates ranged from 364K- 377K. The number of people on unemployment benefit rolls dropped. The prior week’s applications were initially reported at 370K. Last week’s claims were the highest since 392K in late Apr. The 4-week moving average rose to 374K from 370K. The number continuing to collect benefits dropped 36K to 3.24M but that does not include workers receiving extended benefits under federal programs. The unemployment rate among those eligible for benefits held at 2.6%. 34 states & territories reported an increase in claims, while 19 reported a decrease. Another weak jobless claims report is not encouraging before tomorrow's jobs report for May.
Jobless Claims in U.S. Increased by 10,000 to 383,000
The US economy grew at an annual rate of 1.9% in Q1, slower than first estimated (2.2%) according to the Commerce Dept. The downward revision was largely because consumers & govs spent less than first estimated, businesses restocked more slowly & the trade deficit grew sharply. Analysts project the economy is growing at a slightly faster rate in Q2, 2-2½%, & some expect the economy will maintain that pace for all of 2012, an improvement from last year's 1.7% growth. Still, growth of 2.5% is typically enough just to keep pace with population changes. It takes almost twice as much growth to lower the unemployment rate by 1 percentage point over a year. A rising trade deficit slows growth because the country is spending more on foreign-made products than it is taking in from sales of US made goods. Less restocking means companies ordered fewer goods, which decreases factory production & weighs on growth. Consumer spending grew at an annual rate of 2.7% in Q1. While the fastest pace since the end of 2010, it was down from an initial estimate of 2.9%, largely because of fewer auto purchases. Gov spending at all levels fell at a 3.9% annual rate, much more than the 3.0% decline first estimated. It was the 6th straight qtr that gov spending has declined, reflecting budget constraints at the federal, state & local levels. Growth is expected to pick up slightly this spring because of job growth & lower gas prices, allowing consumers to spend more freely. The economic recovery continues to plod along.
Economy in U.S. Expanded Less Than Previously Estimated
Business activity in the US expanded in May at the slowest pace in more than 2 years as orders & production cooled. The Institute for Supply Management said today its gauge decreased to 52.7, the lowest since Sep 2009, from 56.2 in Apr (readings greater than 50 signal growth). Expectations were for a rise to 56.8. While demand for automobiles continues to fuel factory output, the debt crisis in Europe & a slowdown in China may cause some businesses to cut back on spending & hiring. It;s clear, the economy is not charging ahead on all cylinders.
Business Activity in U.S. Unexpectedly Grew at Slower Pace
A dreary day is closing a dreary month. The chart below says it all. Dow is up a measly 125 YTD, not what all those experts had in mind at the start of 2012. Interesting that Apple (AAPL) & Facebook) (FB), both with large market caps & sexy, growth images, are sputtering. The jobs report tomorrow is expected to show a gain of 150K jobs & there is a good chance that the data will disappoint.
Dow Industrials
Get your favorite symbols' Trend Analysis TODAY!


No comments:
Post a Comment