Monday, April 30, 2012

Markets drift lower on the last day in April

Dow dropped 14, decliners over advancers 3-2 & NAZ fell a bigger 22.  The banks led the selling with the Financial Index falling 1½ to the 207s.  The MLP index rose 2½ to the 398s (highest level in more than a month) while the REIT index fell 1 (from the Fri high for 2012) to just below 260.  Junk bond funds were in demand as were Treasuries.  Oil ended little changed.  Gold was also flattish, capping a 3rd straight monthly decline, on concern that demand in India, the world’s biggest buyer, is slowing & after a report showed Spain’s economy entered its 2nd recession since 2009.
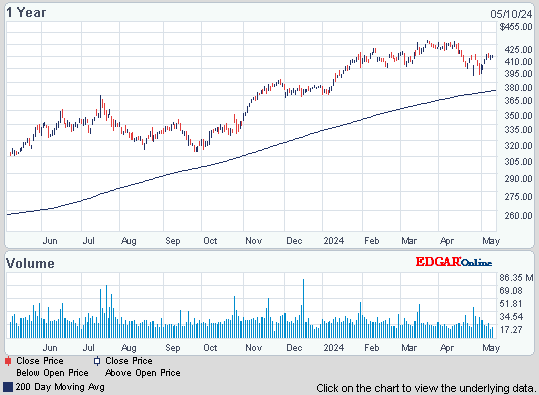
JPMorgan Chase Capital XVI (AMJ)


stock chart


Click below for the latest market update:


Treasury yields:

U.S. 3-month

0.092%

U.S. 2-year

0.258%

U.S. 10-year

1.910%

CLM12.NYM...Crude Oil Jun 12...104.79 ...Down 0.14  (0.1%)

Live 24 hours gold chart [Kitco Inc.]


Manufacturing Cools Even as U.S. Consumers Still Spend: Economy

Photo:    Bloomberg

US business activity expanded in Apr at the slowest pace since the end of 2009, adding to evidence that manufacturing is cooling.  The Institute for Supply Management said its barometer decreased to 56.2, lower than expected, from 62.2 in Mar ((readings greater than 50 signal growth).  The pace of production eased in Apr reflecting a recession in Europe & a slowdown in China that may keep holding back orders.  Projections were that the gauge would fall to 58-62.9.  Household purchases, which account for about 70% of the economy, increased 0.3% in Mar, after a revised 0.9% gain in Feb (stronger than first reported) according to the Commerce Dept.  Stronger activity in winter related to the warm weather may take away from business meant for the months in the spring. 

Manufacturing Cools Even as U.S. Consumers Still Spend
 
  • <p>               FILE - This file product image provided by Barnes & Noble Inc., shows the new $249 Nook Tablet, which was unveiled Monday, Nov. 7, 2011, in New York. Barnes & Noble Inc. and Microsoft Corp. are teaming up to create a new Barnes & Noble subsidiary that will house the digital and college businesses of the bookseller and include a Nook application for Windows 8. The companies said Monday, April 30, 2012 that they are exploring separating those businesses entirely. That could mean a stock offering, sale, or other deal could happen.   (AP Photo/Barnes & Noble Inc., File)
Photo:    Yahoo

Microsoft, a Dow stock, provided an infusion of money to help Barnes & Noble to compete in the e-book business.  It's investing $300M in BKS which sent the stock zooming.  The companies are teaming up to create a subsidiary for BKS e-book & college textbook businesses, with MSFT taking a 17.6% stake, giving BKS ammunition to fend off those who asked for a sale of the Nook e-book business or the whole company.  Instead, they are exploring separating the subsidiary, provisionally dubbed "Newco," entirely from BKS via a stock offering or sale.  For MSFT, the investment means that it will own part of a company that sells tablets based on Google (GOOG) Android, the main competitor of Windows Phone 7 (Microsoft's smartphone software).  MSFT also said the deal means that there will be a Nook application for Windows 8 tablets, set to be released this fall.  MSFT has a long-standing interest in the e-book field after launching e-book software in 2000, but was never able to build a substantial library of books.  It's discontinuing the software on Aug 30.  BKS shot up 7.29 to 21.32 ($6 below its high early in the day) & MSFT was up a few pennies.

Barnes & Noble’s Microsoft Deal to Drive Overseas Sales

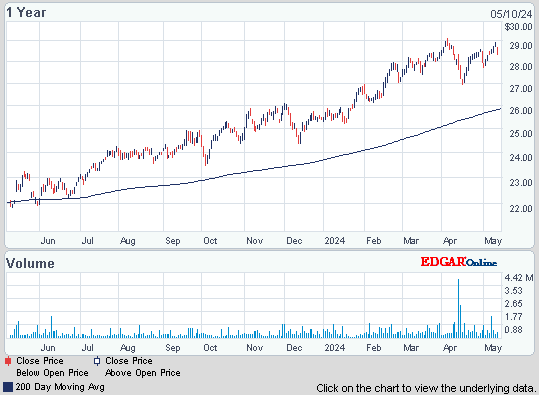
Barnes & Noble, Inc. (BKS)


stock chart

Microsoft Corporation (MSFT)


stock chart


The average price for gas at the pump is getting less attention after slipping back from recent highs (to be expected when crude pulls back).  But it's still only a dime below recent highs & very much at troublesome levels for the economy.. 

12onth Average
State's Graph
Source:   AAA


Dow was up all of 1 in Apr, not bad considering the great run in Q1.  It's up 1K YTD, making the bulls happy.  MLPs have been market leaders off the lows 3 years ago but lost that role in 2012.  However the rally in the last 5 weeks has put the index in the black YTD & within 13 of its record highs reached 2 months ago.  Investors have been bidding up junk bond funds & buying Treasuries in Apr.  That's sort of a mixed message when combined with extending the stock market rally.  But it looks like there is a slight edge for yield securities (risky & investment grade).  Earnings season was only able to allow the markets to recover lost territory, not impressive.

Dow Industrials


stock chart


Get your favorite symbols' Trend Analysis TODAY!


Lower markets on sluggish consumer spending

Dow dropped 36, decliners over advancers 2-1 & NAZ fell 20.  Bank stocks led the selling, bringing the Financial Index down 2 to the 206s (where it was 3 weeks ago).  The MLP index was up a fraction in the 396s but the REIT index fell 1 (from its yearly high) to the 259s.  Junk bond funds rose, continuing on their winning ways in Apr, & Treasuries were higher, taking the yield on the 10 year Treasury near 1.9%.  Oil fell as Spain's economy contracted in Q1 & gold also was lower.

JPMorgan Chase Capital XVI (AMJ)


stock chart

Treasury yields:

U.S. 3-month

0.092%

U.S. 2-year

0.258%

U.S. 10-year

1.917%

CLM12.NYM...Crude Oil Jun 12...104.22 ...Down 0.71  (0.7%)

GCK12.CMX...Gold May 12......1,654.80 ...Down 9.20  (0.6%)


Get the latest daily market update below:


Consumer Spending in U.S. Increases as Incomes Rise

Photo:   Bloomberg

Spending by US consumers slowed in Mar, while income rose at a faster pace according to the Commerce Dept.  Personal spending increased 0.3%, below a 0.9% jump in Feb, much weaker than the 0.5% spending gain forecast.  Adjusting for higher prices, spending increased only 0.1%.  However, income increased a little faster, rising 0.4%, an improvement from the 0.2% gain in the priot month.  This was the first time since Dec that income growth outpaced spending increases, as consumers dipped into savings the previous 2 months to deal with rising prices, such as increases in gasoline prices.  Inflation moderated & it allowed consumers to increase savings again.  The savings rate, which compares after-tax income to the level of spending, edged up to 3.8% from 3.7% in Feb.

Consumer Spending in U.S. Increases as Incomes Rise


Energy Transfer Partners to Buy Sunoco $5.3 Bln Transaction

Photo:   Bloomberg

Energy Transfer Partners, an MLP, is buying Sunoco for $5.3B to give it the capability to transport crude & other liquid hydrocarbons that are being produced in greater quantities from the boom in shale drilling.  SUN pipelines crisscross the country, connecting the Great Lakes & Northeast to refining center along the Gulf Coast.  ETP has been looking to diversify into oil pipelines in response to an expected slowdown in the natural gas pipeline business.  SUN will continue its exit from the refining business.  The deal will bring the cash flow mix for the pipeline businesses at ETP to about 70% natural gas & 30% heavier hydrocarbons.  The offer is worth more than $50 per SUN.  It includes $25 in cash & a portion of an ETP unit.  Shareholders can also opt for $50 in cash.  SUN rose 8.21 to 49.12 & ETP added 59¢ to 48.51.

Sunoco, Inc. (SUN)


stock chart

ENERGY TRANSFER PARTNERS (ETP)


stock chart


Some of the traders may be taking longer weekends, so markets are pausing after another leg up last week.  There were corp deals today, but they are not bringing out buyers.  Dow is less than a 100 from its multi yearly highs, needing other news to reach 13.3K (its next  objective).

Dow Industrials


stock chart


Get your favorite symbols' Trend Analysis TODAY!  

Friday, April 27, 2012

Markets crawl higher on mixed earnings

Dow went up 23, advancers over decliners 2-1 & NAZ had a better day off a lower base, up 18.  The Financial Index was flattish in the 208s as increased regulation weighed on the stocks. The MLP index was up 2 to the 396s (up 15 in 3 weeks) & the REIT index  rose almost 2 to the 261s, a new high since the pre-Lehman days.  Junk bond funds were mixed to higher & Treasuries rose.  Oil & gold had minor gains. 

JPMorgan Chase Capital XVI (AMJ)


stock chart


Click below for the latest market update:


Treasury yields:

U.S. 3-month

0.086%

U.S. 2-year

0.258%

U.S. 10-year

1.930%

CLM12.NYMCrude Oil Jun 12104.94 Up 0.39 (0.4%)

Live 24 hours gold chart [Kitco Inc.]


The largest US banks told the Federal Reserve (FED) that a limit on their credit exposure is unnecessary & “fundamentally flawed.”  The FED’s proposed rules on single-counterparty credit limits would have a negative impact on banks, their customers & the US economy.  In Dec the FED proposed tougher standards to supervise the largest banks whose collapse could jeopardize the economy by setting a limit of 10% for credit risk between a company considered systemically important & counterparty when each has more than $500B in total assets.  The proposed rules would set triggers for regulatory enforcement for systemic firms & require boards of directors to oversee & approve plans for limiting liquidity risk.  The 10% credit risk limit is more restrictive than that contained in the Dodd-Frank financial overhaul law, which allowed for a 25% limit.  The focus of the complaints are on the proposal on the single-counterparty exposure limit.  They argue it goes too far without justification from the FED for its change.  Further, they disagree with the central bank on its proposed formula for determining counterparty exposure.  More gov interference is not a plus in any market.

Largest U.S. Banks Resist Federal Reserve’s Credit Limits

  • <p>               FILE - This Oct. 25, 2011, file photo, shows a Ford logo,on the tailgate of a pick-up truck, and on a Ford dealership sign at Salem Ford in Salem, N.H.  Ford Motor Co. said Friday, April 27, 2012, its net income fell by 45 percent in the first quarter as European sales plummeted and the company paid higher taxes. It earned $1.4 billion, or 35 cents per share, in the first quarter.  (AP Photo/Charles Krupa, File)
Photo:    Yahoo

North America propped up Ford profits in Q1, which otherwise took a beating from plummeting European sales & higher taxes.  Net income fell 45% from a year earlier (although Q1 2011 was its best Q1 since 1998).  However that beat expectations & its outlook was upbeat.  Ford expects improvement in H2 as more plant capacity opens.  It's also hoping a new plan to offer lump-sum pension payments to retirees will wipe $M in liabilities off its books.  The first payments will be offered to 90K US white-collar retirees & former employees, the largest such offer in US history.  EPS was 35¢, down from 61¢ last year.  Nearly half the decrease was due to paying a higher tax rate.  At the end of last year, the company moved tax credits & other assets back onto its books, after moving them off in 2006 when it wasn't making a profit.  Ford is now paying a 32.5% tax rate, compared with 8% a year ago.  Revenue fell 2% to $32.4B.  Without one-time items, including buyouts of almost 2K US. factory workers, EPS was 39¢, better than predictions of 35¢ on revenue of $32.3B.  Ford lost money in Europe, where sales fell 60K vehicles, & Asia, where sales fell 25K as China's appetite for new cars slowed.  But in North America, it recorded the highest quarterly profit since 2000 with pretax profit rising 17% to $2.1B (even as its US market share fell to 15.2%, from 16% last year).  The company cut production costs & is making more money on each vehicle because buyers are choosing more expensive options, like its MyFord Touch touch-screen dashboard system.  TrueCar.com said US buyers paid an average of $31.7K for Ford cars & trucks in Q1, up more than $1.2K from last year.  The stock fell 26¢.

Ford Profit Falls on Losses in International Operations

Ford Motor Company (F)


stock chart


Amazon’s First-Quarter Revenue Tops Estimates on Kindle Sales

Photo:   Bloomberg

Stellar quarterly results for Amazon are helping convince skeptics intense spending is beginning to pay off for an Internet retailer trying to transform itself into a technology company.  CEO Jeff Bezos has tried to convince investors to stick with the company for the long term as it flirted with losses in recent qtrs.  He is trying to transform Amazon from an online version of a big-box retailer into a provider of technology services.  But some argue that its valuation over 70 times forward earnings is justified because AMZN is on track for enormous margin expansion as it expands into more-profitable services from hosting websites in the cloud to providing an online marketplace connecting buyers & sellers.  Seems like I've heard that line of reasoning before.  Amazon is trying to be "not a bookseller or a retailer, but a company that uses technology & (now) its scale to transform whole value chains" from retail to publishing & video distribution.  Heavy spending has pressured profit margins in recent qtrs.  But in Q1, gross margins rose 120 basis points to about 24%.  That surprise increase in gross margins prompted a flurry of price target increases by analysts.  It is believed that faster growth at its online marketplace business & cloud unit Amazon Web Services, along with sales of digital goods, drove the improvement in margins.  Amazon's 34% revenue increase to $13.2B also beat expected revenue of $12.9B.  During Q1, 9 of the 10 top-selling products on Amazon.com were digital products, including Kindle e-books, movies, music & apps.  Analysts at a bunch of firms raised their price target on the stock & one upgraded it to "buy" from "neutral.  The stock shot up $31 to $227.

Amazon’s First-Quarter Revenue Tops Estimates on Kindle Sales; Shares Jump

Amazon.com, Inc. (AMZN)


stock chart


Markets took a bit of a breather after 3 up days.  Dow inched over its 2012 high of 13,264 by 2 but couldn't hold that level.  Earnings continue to be somewhat muddy.  Starbucks (SBUX) fell $3 on a report that was good, but not good enough.  We've seen a lot of that in this earnings season.  Soggy European business hurt, another common theme in Q1 reports.  Dow is up 500 in the last 2½ weeks, I guess it was more impressed with earnings than I was.  Next week will be the test to see if breaks thru to new 2012 highs.

Dow Industrials


stock chart


Get your favorite symbols' Trend Analysis TODAY!