Dow went up 25, advancers 2-1 ahead of decliners & NAZ added 16. The Financial Index was up a fraction to 207. The MLP index rose 2½ to 392 (helped by new regulations on fracking) & the REIT index was up 1 to the 253s. Junk bond funds were mixed to higher & Treasuries had modest gains. Oil was pretty much sideways while gold found a few buyers.

The Labor Dept said weekly jobless applications dipped last week 2K to 386K, but that was after it revised up the previous week's data to show 8K more people applied for benefits than first estimated. The 4-week average, rose 5K to 375K, the highest level in 3 months. This was discouraging news, suggesting jobs growth is slowing.
US jobless data take shine off markets AP

Photo: Bloomberg
Americans bought fewer previously owned homes in Mar, a reminder that the housing market remains weak. The National Association of Realtors said that home sales fell 2.6% to an annual rate of 4.48M, following a revised figure of 4.6M in Feb. A mild winter may have encouraged more to buy earlier, essentially stealing sales from Mar. The first 3 months of 2012 made up the best winter for sales in 5 years & the increase offers some encouragement ahead of the spring-buying season. Still, sales remain far below the 6M rate that equates with healthy markets. First-time buyers, who are critical to a housing recovery, rose to 33% of all purchases, but in healthy markets they make up at least 40%. The supply of homes on the market fell 1.3% to 2.37M, which could help drive up prices further in the coming months. One reason is that home foreclosures declined, although they are still high. Homes at risk of foreclosure made up 29% of sales, down from 34% in Feb. In healthier markets, foreclosures make up less than 10%. Positive signs include mortgage rates hovering just above record lows & the median sales price of homes rose for the 2nd straight month in Mar, to $163K. Housing is still far from a recovery.
Sales of Previously Owned Homes in U.S. Unexpectedly Declined Last Month

Photo: Bloomberg
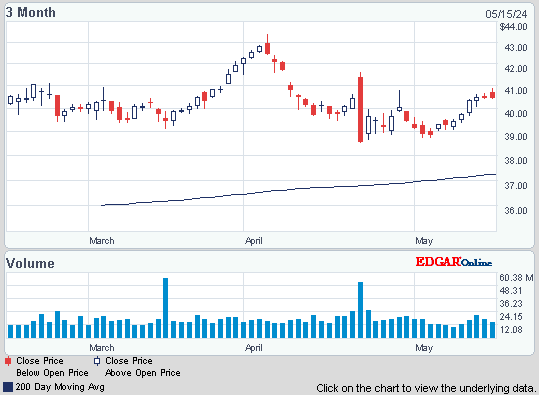
Verizon, a Dow stock, posted Q1 earnings & revenue that beat expectations as customers increased spending on services such as wireless data. While wireless customer growth slowed, CFO Shammo said the mobile venture, Verizon Wireless, saw the fastest growth in mobile service revenue in 3 years as more customers used smartphones. Verizon Wireless average monthly revenue per user (ARPU) for contract customers rose 3.6% to $55.43 compared with expectations for growth closer to 3%. This was helped by data service revenue that grew 16% to $23.80. Shammo said the growth should continue as more people buy smartphones & the company offers new shared data service plans this summer under which customers will be able to connect more than one device under a single data service plan. "We're confident we'll continue to accelerate our growth in this area," Shammo said. VZ sold 3.2M iPhones & 2M phones using its fastest network based on Long Term Evolution (LTE) technology. EPS rose to 59¢ compared with expectations for 58¢ & 51¢ last year. Revenue rose to $28.2B from $27B & was ahead of the forecast for $28.2B. Stockholders liked the news, taking it up 86¢.
Verizon Profit Beats Estimates as Slowing IPhone Sales Widen Profit Margin

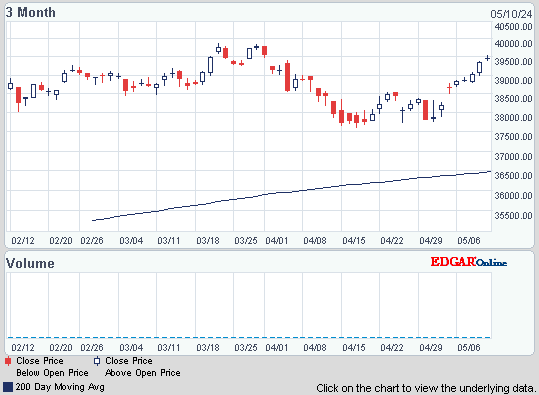
Markets are back to spinning their wheels, although buyers have the upper hand presently. The US economic data is so-so. Bank earnings have not been inspiring. Spain is muddling by but that looks like it will get a lot worse in the short term. The Dow chart shows after cracking thru 13K it has been going nowhere. Bulls say that is a welcome way to digest big gains in the last 6 months. I don't know.

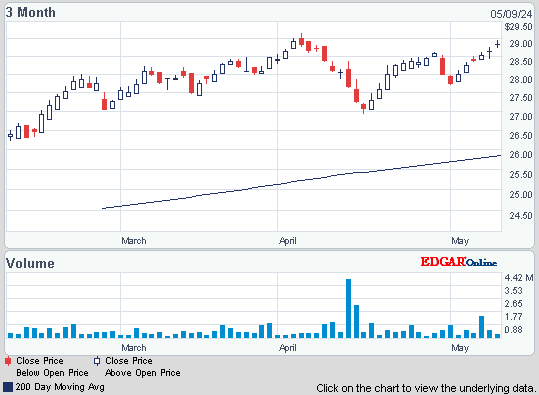
JPMorgan Chase Capital XVI (AMJ)
Treasury yields:
U.S. 3-month | 0.066% | |
U.S. 2-year | 0.266% | |
U.S. 10-year | 1.954% |
| CLK12.NYM | ...Crude Oil May 12 | ...102.40 | ..... | (0.3%) |
| GCJ12.CMX | ....Gold Apr 12 | .........1,653.00 | ... | (0.9%) |
Get the latest daily market update below:
The Labor Dept said weekly jobless applications dipped last week 2K to 386K, but that was after it revised up the previous week's data to show 8K more people applied for benefits than first estimated. The 4-week average, rose 5K to 375K, the highest level in 3 months. This was discouraging news, suggesting jobs growth is slowing.
US jobless data take shine off markets AP

Americans bought fewer previously owned homes in Mar, a reminder that the housing market remains weak. The National Association of Realtors said that home sales fell 2.6% to an annual rate of 4.48M, following a revised figure of 4.6M in Feb. A mild winter may have encouraged more to buy earlier, essentially stealing sales from Mar. The first 3 months of 2012 made up the best winter for sales in 5 years & the increase offers some encouragement ahead of the spring-buying season. Still, sales remain far below the 6M rate that equates with healthy markets. First-time buyers, who are critical to a housing recovery, rose to 33% of all purchases, but in healthy markets they make up at least 40%. The supply of homes on the market fell 1.3% to 2.37M, which could help drive up prices further in the coming months. One reason is that home foreclosures declined, although they are still high. Homes at risk of foreclosure made up 29% of sales, down from 34% in Feb. In healthier markets, foreclosures make up less than 10%. Positive signs include mortgage rates hovering just above record lows & the median sales price of homes rose for the 2nd straight month in Mar, to $163K. Housing is still far from a recovery.
Sales of Previously Owned Homes in U.S. Unexpectedly Declined Last Month

Verizon, a Dow stock, posted Q1 earnings & revenue that beat expectations as customers increased spending on services such as wireless data. While wireless customer growth slowed, CFO Shammo said the mobile venture, Verizon Wireless, saw the fastest growth in mobile service revenue in 3 years as more customers used smartphones. Verizon Wireless average monthly revenue per user (ARPU) for contract customers rose 3.6% to $55.43 compared with expectations for growth closer to 3%. This was helped by data service revenue that grew 16% to $23.80. Shammo said the growth should continue as more people buy smartphones & the company offers new shared data service plans this summer under which customers will be able to connect more than one device under a single data service plan. "We're confident we'll continue to accelerate our growth in this area," Shammo said. VZ sold 3.2M iPhones & 2M phones using its fastest network based on Long Term Evolution (LTE) technology. EPS rose to 59¢ compared with expectations for 58¢ & 51¢ last year. Revenue rose to $28.2B from $27B & was ahead of the forecast for $28.2B. Stockholders liked the news, taking it up 86¢.
Verizon Profit Beats Estimates as Slowing IPhone Sales Widen Profit Margin
Verizon Communications Inc. (VZ)
Markets are back to spinning their wheels, although buyers have the upper hand presently. The US economic data is so-so. Bank earnings have not been inspiring. Spain is muddling by but that looks like it will get a lot worse in the short term. The Dow chart shows after cracking thru 13K it has been going nowhere. Bulls say that is a welcome way to digest big gains in the last 6 months. I don't know.
Dow Industrials
Get your favorite symbols' Trend Analysis TODAY!


No comments:
Post a Comment