Stocks started the day lower & have not been able to find any strength. Dow lost 143, decliners over advancers 6-1 & NAZ lost 51 (ahead of Apple earnings tomorrow evening). After a strong Apr, the MLP index fell 3 to the 391s & the REIT index fell 3½ to the 251s (its 12 month high). Junk bond funds were mixed but Treasuries rose on growing uncertainties over euro debts. Oil slumped with the lower stock markets & gold also fell.
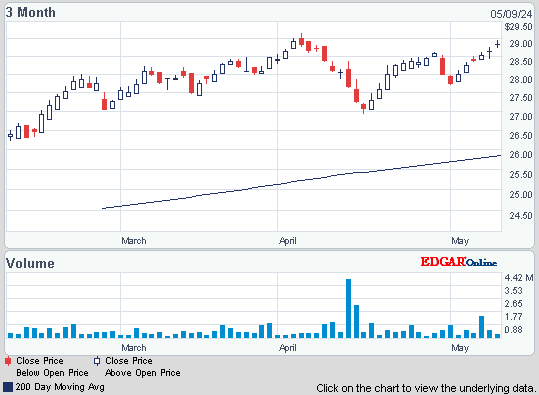

Photo: Bloomberg
The euro region debt rose last year to the highest since the start of the € as govs increased borrowing to plug budget deficits & bailouts of nations crippled by the fiscal crisis. The debt of the 17 euro nations climbed to 87% of GDP in 2011 from 85% in the previous year according to EU figures, the highest since the € was introduced in 1999. Greece topped the list with debt at 165% of GDP & Estonia had the least at 6%. Euro nations are on the hook for the bulk of the €386B ($508B) in bailouts for Greece, Ireland & Portugal after those nations were forced to seek rescues when their borrowing costs become unsustainable. Concern that Spain & Italy may follow has caused their bonds to decline for 6 weeks, pushing yields toward the 7% level that triggered the other aid programs. The yield on Italy’s 10-year bond is up to 5.72% percent, pushing the difference with German securities to 406 basis points. The Spanish 10-year yield rose to 5.98%. Italy ended 2011 with the 2nd-highest debt at 120% of GDP & Spain’s rose to 68% from 61%. Meanwhile, Germany posted one of the only declines, with its debt shrinking to 81% from 83%. Only 5 euro-region nations (all smaller ones) had debt within the euro-region’s limit of 60% of GDP. More disturbing news on the euro debt front.
Euro-Region Debt Rises to Highest in Currency’s History
Photo: Yahoo
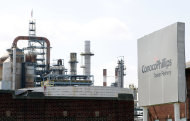
ConocoPhillips Q1 profit dropped 3% due to a decline in production following the sale of oil fields & other assets. EPS was $2.27 versus $2.09 last year & revenue was flat at $58.4B. Excluding special items, EPS of $2.02 was below expectations of $2.08 & revenue of $60B. COP has shed more than $20B in assets since 2010 as part of a plan to split into separate companies. One company will keep the ConocoPhillips name & focus on exploration & production. The other company, Phillips 66, will specialize in refineries pipelines. With fewer producing assets, oil & natural gas production dropped 3.8% to 1.64M barrels of oil equivalent per day in Q1. Oil platforms also were temporarily suspended off the coast of China because of an oil spill. Crude oil was sold for higher prices, but natural gas prices declined. Its refineries sold less gasoline, diesel & other petroleum products. Total refining sales dropped by 11.2% & refining profit fell 6.2%. Its midstream business, which includes pipelines, increased profits 27% & its chemicals business boosted profits 13%. The stock fell 77¢, higher crude oil prices have not helped the stock this year.
Conoco Profit Falls on Lower Production, Refining Earnings
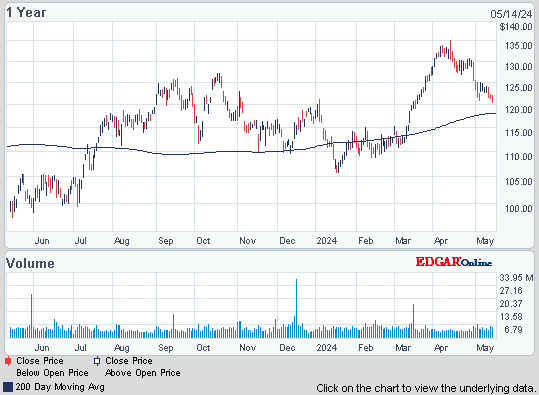
Photo: Yahoo
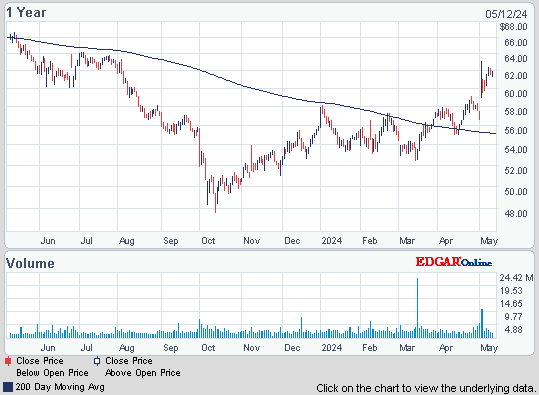
Kellogg cut its 2012 forecast because of slower sales growth in Q1. It now expects a full-year EPS of $3.18-$3.30 because of the weaker sales growth in Europe & for some US products. That includes a charge of 6-11¢ from the $2.7B acquisition of Pringles. Analysts were predicting EPS of $3.48. In early Feb, 2012 net income was predicted to rise 2-4%, excluding changes in currency values operating profit, unchanged for the year. The company now expects operating profit to decrease 2-4% in 2012. For all of 2011, EPS was $3.38 & operating profit was $2B. Internal revenue, excluding the effect of changing currency values as well as acquisitions & sales of company divisions, should grow 2-3% which compares with a prediction of 4-5% made in Feb. In Q1 it said it had EPS of $1, unchanged from last year. Analysts were predicting 99¢. The company said revenue fell 1.3%, suggesting revenue of $3.4B versus a expectations of $3.6B. "We are obviously disappointed with the performance of the company in the first quarter of 2012. We faced more significant challenges in both Europe and in some categories in the U.S. than we expected," CEO John Bryant said. The stock dropped 2.55 (5%).
Kellogg Cuts Full-Year Profit Forecast
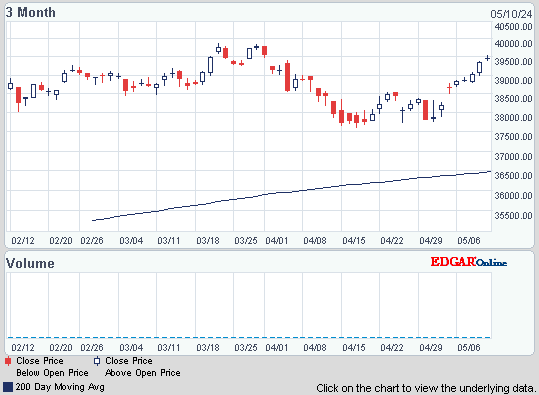
Markets are a having another dreary day in what may be a dreary week. Earnings season is winding down & they have not been able to inspire buyers to return to the markets. It seems like Euro debt concerns are increasing every day. Gas at the pump has pulled back to $3.86 reflecting lower prices for crude. But gas prices remain high enough to pinch consumers. The Dow is back down to 12.9K as 13K is proving to be a formidable ceiling which is holding back the stock market advance.
JPMorgan Chase Capital XVI (AMJ)
Treasury yields:
U.S. 3-month | 0.071% | |
U.S. 2-year | 0.258% | |
U.S. 10-year | 1.916% |
| CLM12.NYM | ...Crude Oil Jun 12 | ...102.18 | .... | (1.6%) |
| GCJ12.CMX | ....Gold Apr 12 | ........1,629.00 | ... | (0.8%) |
Get the latest daily market update below:

The euro region debt rose last year to the highest since the start of the € as govs increased borrowing to plug budget deficits & bailouts of nations crippled by the fiscal crisis. The debt of the 17 euro nations climbed to 87% of GDP in 2011 from 85% in the previous year according to EU figures, the highest since the € was introduced in 1999. Greece topped the list with debt at 165% of GDP & Estonia had the least at 6%. Euro nations are on the hook for the bulk of the €386B ($508B) in bailouts for Greece, Ireland & Portugal after those nations were forced to seek rescues when their borrowing costs become unsustainable. Concern that Spain & Italy may follow has caused their bonds to decline for 6 weeks, pushing yields toward the 7% level that triggered the other aid programs. The yield on Italy’s 10-year bond is up to 5.72% percent, pushing the difference with German securities to 406 basis points. The Spanish 10-year yield rose to 5.98%. Italy ended 2011 with the 2nd-highest debt at 120% of GDP & Spain’s rose to 68% from 61%. Meanwhile, Germany posted one of the only declines, with its debt shrinking to 81% from 83%. Only 5 euro-region nations (all smaller ones) had debt within the euro-region’s limit of 60% of GDP. More disturbing news on the euro debt front.
Euro-Region Debt Rises to Highest in Currency’s History
Photo: Yahoo
ConocoPhillips Q1 profit dropped 3% due to a decline in production following the sale of oil fields & other assets. EPS was $2.27 versus $2.09 last year & revenue was flat at $58.4B. Excluding special items, EPS of $2.02 was below expectations of $2.08 & revenue of $60B. COP has shed more than $20B in assets since 2010 as part of a plan to split into separate companies. One company will keep the ConocoPhillips name & focus on exploration & production. The other company, Phillips 66, will specialize in refineries pipelines. With fewer producing assets, oil & natural gas production dropped 3.8% to 1.64M barrels of oil equivalent per day in Q1. Oil platforms also were temporarily suspended off the coast of China because of an oil spill. Crude oil was sold for higher prices, but natural gas prices declined. Its refineries sold less gasoline, diesel & other petroleum products. Total refining sales dropped by 11.2% & refining profit fell 6.2%. Its midstream business, which includes pipelines, increased profits 27% & its chemicals business boosted profits 13%. The stock fell 77¢, higher crude oil prices have not helped the stock this year.
Conoco Profit Falls on Lower Production, Refining Earnings
ConocoPhillips (COP)
Photo: Yahoo
Kellogg cut its 2012 forecast because of slower sales growth in Q1. It now expects a full-year EPS of $3.18-$3.30 because of the weaker sales growth in Europe & for some US products. That includes a charge of 6-11¢ from the $2.7B acquisition of Pringles. Analysts were predicting EPS of $3.48. In early Feb, 2012 net income was predicted to rise 2-4%, excluding changes in currency values operating profit, unchanged for the year. The company now expects operating profit to decrease 2-4% in 2012. For all of 2011, EPS was $3.38 & operating profit was $2B. Internal revenue, excluding the effect of changing currency values as well as acquisitions & sales of company divisions, should grow 2-3% which compares with a prediction of 4-5% made in Feb. In Q1 it said it had EPS of $1, unchanged from last year. Analysts were predicting 99¢. The company said revenue fell 1.3%, suggesting revenue of $3.4B versus a expectations of $3.6B. "We are obviously disappointed with the performance of the company in the first quarter of 2012. We faced more significant challenges in both Europe and in some categories in the U.S. than we expected," CEO John Bryant said. The stock dropped 2.55 (5%).
Kellogg Cuts Full-Year Profit Forecast
Kellogg Company (K)
Markets are a having another dreary day in what may be a dreary week. Earnings season is winding down & they have not been able to inspire buyers to return to the markets. It seems like Euro debt concerns are increasing every day. Gas at the pump has pulled back to $3.86 reflecting lower prices for crude. But gas prices remain high enough to pinch consumers. The Dow is back down to 12.9K as 13K is proving to be a formidable ceiling which is holding back the stock market advance.
Dow Industrials
Get your favorite symbols' Trend Analysis TODAY!



No comments:
Post a Comment