

Dow fell 48, decliners over advancers 3-2 & NAZ was 20 lower. The Financial Index fell fractionally to just above 210. The MLP index was up a fraction in the 403s after trading sideways in Q3 & the REIT index lost pocket change in the 262s. Junk bond funds were flattish & Treasuries had a 2nd
straight weekly gain as European leaders struggle to resolve the
region’s debt crisis & reports suggest slower US growth,
sustaining the appeal of the world’s safest assets. Oil & gold were flattish but gold had a very good Q3 with plenty of talk about $2K gold again.


![Live 24 hours gold chart [Kitco Inc.]](http://www.kitco.com/images/live/gold.gif)


Photo: Bloomberg
Spain’s banks have a combined capital shortfall of €59.3B, according to a stress test the Spanish gov commissioned. That figure doesn’t include impact of mergers underway or differed tax assets. Including those 2 elements, the shortfall declines to €53.7B. Banco Populat Espanol needs €3.22B in an adverse scenario, after the tax impact. Banco Santander, Banco Bilboa Vizcaya Argentaria, CaixaBank, Banco Sabadell, Kutxabank, Bankinter & Unicaja need no additional capital, the Bank of Spain said.
Spain Stress Tests Show Capital Shortfall of EU59.3 Billion
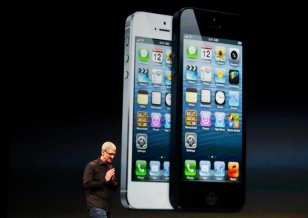
Photo: Yahoo
Apple has endured a week-plus of heavy & rare criticism for the lousiness of the Maps program on its new iPhone 5. CEO Tim Cook is pleading for forgiveness. He said that AAPL had let its customers down by putting out a subpar product. "We are extremely sorry for the frustration this has caused our customers and are doing everything we can to make Maps better." The iPhone 5 went on sale Sep 21, & complaints about the shortcomings of the Maps program started early & came often. Phone buyers felt Apple Maps wasn't even approaching the standard set by Google Maps (GOOF), much less surpassing it, prompting a frantic search for a replacement. For Cook, the apology comes only days after one of the biggest Apple product launches he's overseen since the death of company co-founder Steve Jobs. The stock lost $13 today & is down $37 from its recent record highs.
Apple CEO: Agreed, We Blew It With Maps
The UK faces an increased risk of a downgrade to its AAA credit rating after Fitch said that gov debt will peak at a higher level & later than it previously predicted. Fitch affirmed Britain’s AAA level & kept the nation on negative outlook. Fitch said it doesn’t expect to resolve the question mark hanging over the top grade until 2014. “The negative outlook on the UK rating reflects the very limited fiscal space, at the ’AAA’ level, to absorb further adverse economic shocks in light of the U.K.’s elevated debt levels and uncertain growth outlook,” Fitch said. “Weaker than expected growth and fiscal outturns in 2012 have increased pressure on the U.K.’s AAA rating.” The assessment comes a week after Britain posted its biggest Aug budget deficit on record & adds pressure on Chancellor of the Exchequer as the economy recovers from 3 qtrs of contraction. Fitch cut its forecast for economic growth this year to show it will shrink 0.3% instead of expanding by 0.8%. These are the kind of issues faced by the US & the US will reach is maximum borrowing capacity within 6 months
U.K. AAA Rating Now Faces Greater Risk of Downgrade, Fitch Says
Dow lost ground this week but rose over 500 in Q3. It's up 1.2K YTD for a 10% gain. That is impressive considering the soggy state of the economy which seems to be getting worse as the fiscal cliff approaches. Q4 generally is a good time for the markets, maybe not this year. Sep is the worst month for the markets but this year Dow gained 350. The jobs report on Fri will set the tone for the rest of Q4.
AMJ (Alerian MLP Index tracking fund)
Click below for the latest market update:
Treasury yields:
U.S. 3-month |
0.091% | |
U.S. 2-year |
0.234% | |
U.S. 10-year |
1.639% |
| CLX12.NYM | ...Crude Oil Nov 12 | ....92.02 | ... | (0.2%) |
Spain’s banks have a combined capital shortfall of €59.3B, according to a stress test the Spanish gov commissioned. That figure doesn’t include impact of mergers underway or differed tax assets. Including those 2 elements, the shortfall declines to €53.7B. Banco Populat Espanol needs €3.22B in an adverse scenario, after the tax impact. Banco Santander, Banco Bilboa Vizcaya Argentaria, CaixaBank, Banco Sabadell, Kutxabank, Bankinter & Unicaja need no additional capital, the Bank of Spain said.
Spain Stress Tests Show Capital Shortfall of EU59.3 Billion
Photo: Yahoo
Apple has endured a week-plus of heavy & rare criticism for the lousiness of the Maps program on its new iPhone 5. CEO Tim Cook is pleading for forgiveness. He said that AAPL had let its customers down by putting out a subpar product. "We are extremely sorry for the frustration this has caused our customers and are doing everything we can to make Maps better." The iPhone 5 went on sale Sep 21, & complaints about the shortcomings of the Maps program started early & came often. Phone buyers felt Apple Maps wasn't even approaching the standard set by Google Maps (GOOF), much less surpassing it, prompting a frantic search for a replacement. For Cook, the apology comes only days after one of the biggest Apple product launches he's overseen since the death of company co-founder Steve Jobs. The stock lost $13 today & is down $37 from its recent record highs.
Apple CEO: Agreed, We Blew It With Maps
Apple (AAPL)
The UK faces an increased risk of a downgrade to its AAA credit rating after Fitch said that gov debt will peak at a higher level & later than it previously predicted. Fitch affirmed Britain’s AAA level & kept the nation on negative outlook. Fitch said it doesn’t expect to resolve the question mark hanging over the top grade until 2014. “The negative outlook on the UK rating reflects the very limited fiscal space, at the ’AAA’ level, to absorb further adverse economic shocks in light of the U.K.’s elevated debt levels and uncertain growth outlook,” Fitch said. “Weaker than expected growth and fiscal outturns in 2012 have increased pressure on the U.K.’s AAA rating.” The assessment comes a week after Britain posted its biggest Aug budget deficit on record & adds pressure on Chancellor of the Exchequer as the economy recovers from 3 qtrs of contraction. Fitch cut its forecast for economic growth this year to show it will shrink 0.3% instead of expanding by 0.8%. These are the kind of issues faced by the US & the US will reach is maximum borrowing capacity within 6 months
U.K. AAA Rating Now Faces Greater Risk of Downgrade, Fitch Says
Dow lost ground this week but rose over 500 in Q3. It's up 1.2K YTD for a 10% gain. That is impressive considering the soggy state of the economy which seems to be getting worse as the fiscal cliff approaches. Q4 generally is a good time for the markets, maybe not this year. Sep is the worst month for the markets but this year Dow gained 350. The jobs report on Fri will set the tone for the rest of Q4.
Dow Jones Industrials
Get your favorite symbols' Trend Analysis TODAY!


