Dow climbed 72, advancers ahead of decliners 3-1 & NAZ was up 42. The Financial Index rose 2 to go over 210. The MLP index was up 3 to 403 (only 8 below its record high reached in early 2012) & the REIT index was up 1+ to the 262s. Junk bond funds were mixed to lower & Treasuries slipped back in a rising stock market. Oil added almost $2 & gold surged $27 (bets against stimulus programs).

![Live 24 hours gold chart [Kitco Inc.]](http://www.kitco.com/images/live/gold.gif)


Photo: Bloomberg
Demand for US durable goods, other than transportation equipment, unexpectedly dropped in Aug for a 3rd consecutive month, signaling that slowdowns in business investment & exports will restrain the economic expansion. Orders for goods meant to last at least 3 years, excluding volatile demand for airplanes & automobiles, fell 1.6% last month after decreasing 1.3% in Jul, according to the Commerce Dept. Total bookings plunged 13.2%, the most since Jan 2009, as demand for civilian aircraft collapsed. This is chilling data. Companies such as Caterpillar, a Dow company, are cutting forecasts as slowing global growth dents sales, while the approaching fiscal cliff of tax increases & gov budget cuts is causing US businesses to curb spending. The forecast was for a 0.2% gain in ex-transportation goods orders & the Jul data was revised down from a previously reported 0.6% decrease.
Plunge in Goods Orders May Restrain U.S. Expansion: Economy
The US economy grew less than previously forecast in Q2, reflecting slower gains in consumer spending & farm inventories. GDP expanded at a 1.3% pace in Q2 after growing at a 2% rate in Q1. The revision compared with a prior estimate of 1.7% & 1.7% expected by analysts. Household purchases, about 70% of the economy, rose at a 1.5% annual pace, the slowest in a year after a previously reported 1.7% gain. Purchases advanced at a 2.4% rate in Q1. The drought caused the gov to revise down estimates for farm inventories, which also contributed to the smaller reading in GDP. Q3 stockpile readings will also be depressed by smaller farm inventories due to the weather, the Commerce Dept said. After growing at a 4% pace in Q4 2011, the deceleration over the past 2 qtrs shows the US is struggling to gain momentum as consumer & companies curb spending. To speed the expansion & reduce 8.1% unemployment, the Federal Reserve said it will expand its holdings of long-term securities & keep its target interest rate near zero until at least mid-2015.
Madrid Protesters March Again as Spain Braces for Cuts

Photo: Bloomberg
US oil production surged last week to the highest level since Jan 1997, reducing the country’s dependence on imported fuels as new technology unlocks crude trapped in shale formations. Crude output rose 3.7% to 6.5M barrels a day, according to the Energy Dept. America met 83 % of its energy needs in the first 6 months of the year. If the trend continues thru 2012, it will be the highest level of self- sufficiency since 1991. Imports have declined 3.2% from the same period a year earlier. A combination of horizontal drilling & hydraulic fracturing, or fracking, has helped reduce America’s reliance on foreign oil. The same technology unleashed a boom in natural gas output from shale that pushed inventories to a record last year. In addition to benefiting energy companies, MLPs are investing heavily in infrastructure to move this energy around the US.
U.S. Pumps Most Oil Since 1997 as Energy Independence Grows
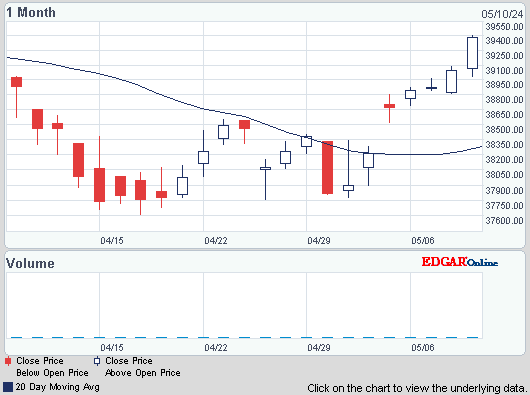
There is less going on in the markets than today's rise suggests. The Dow chart below shows how it has been lumbering along for 2 weeks (after reaching a 4 year high). The economic news continues to be dismal. While the revision downward for US GDP in Q2, is history, the implications for Q3 & Q4 are not good. The weak countries in Europe remain weak, hoping another round of bailouts will cure fundamental problems. China is in its kind of recession, growth at "only" a 7% rate. Next Fri will be the jobs report for Sep & it's difficult to make a case for a positive report. Then earnings season begins which could bring disappointment. Dow is still barely above the important 13.4K floor.

AMJ (Alerian MLP Index tracking fund)
Click below for the latest market update:
Treasury yields:
U.S. 3-month |
0.086% | |
U.S. 2-year |
0.250% | |
U.S. 10-year |
1.635% |
| CLX12.NYM | ...Crude Oil Nov 12 | ....91.88 | ... | (2.1%) |
![Live 24 hours gold chart [Kitco Inc.]](http://www.kitco.com/images/live/gold.gif)


Demand for US durable goods, other than transportation equipment, unexpectedly dropped in Aug for a 3rd consecutive month, signaling that slowdowns in business investment & exports will restrain the economic expansion. Orders for goods meant to last at least 3 years, excluding volatile demand for airplanes & automobiles, fell 1.6% last month after decreasing 1.3% in Jul, according to the Commerce Dept. Total bookings plunged 13.2%, the most since Jan 2009, as demand for civilian aircraft collapsed. This is chilling data. Companies such as Caterpillar, a Dow company, are cutting forecasts as slowing global growth dents sales, while the approaching fiscal cliff of tax increases & gov budget cuts is causing US businesses to curb spending. The forecast was for a 0.2% gain in ex-transportation goods orders & the Jul data was revised down from a previously reported 0.6% decrease.
Plunge in Goods Orders May Restrain U.S. Expansion: Economy
The US economy grew less than previously forecast in Q2, reflecting slower gains in consumer spending & farm inventories. GDP expanded at a 1.3% pace in Q2 after growing at a 2% rate in Q1. The revision compared with a prior estimate of 1.7% & 1.7% expected by analysts. Household purchases, about 70% of the economy, rose at a 1.5% annual pace, the slowest in a year after a previously reported 1.7% gain. Purchases advanced at a 2.4% rate in Q1. The drought caused the gov to revise down estimates for farm inventories, which also contributed to the smaller reading in GDP. Q3 stockpile readings will also be depressed by smaller farm inventories due to the weather, the Commerce Dept said. After growing at a 4% pace in Q4 2011, the deceleration over the past 2 qtrs shows the US is struggling to gain momentum as consumer & companies curb spending. To speed the expansion & reduce 8.1% unemployment, the Federal Reserve said it will expand its holdings of long-term securities & keep its target interest rate near zero until at least mid-2015.
Madrid Protesters March Again as Spain Braces for Cuts

US oil production surged last week to the highest level since Jan 1997, reducing the country’s dependence on imported fuels as new technology unlocks crude trapped in shale formations. Crude output rose 3.7% to 6.5M barrels a day, according to the Energy Dept. America met 83 % of its energy needs in the first 6 months of the year. If the trend continues thru 2012, it will be the highest level of self- sufficiency since 1991. Imports have declined 3.2% from the same period a year earlier. A combination of horizontal drilling & hydraulic fracturing, or fracking, has helped reduce America’s reliance on foreign oil. The same technology unleashed a boom in natural gas output from shale that pushed inventories to a record last year. In addition to benefiting energy companies, MLPs are investing heavily in infrastructure to move this energy around the US.
U.S. Pumps Most Oil Since 1997 as Energy Independence Grows
There is less going on in the markets than today's rise suggests. The Dow chart below shows how it has been lumbering along for 2 weeks (after reaching a 4 year high). The economic news continues to be dismal. While the revision downward for US GDP in Q2, is history, the implications for Q3 & Q4 are not good. The weak countries in Europe remain weak, hoping another round of bailouts will cure fundamental problems. China is in its kind of recession, growth at "only" a 7% rate. Next Fri will be the jobs report for Sep & it's difficult to make a case for a positive report. Then earnings season begins which could bring disappointment. Dow is still barely above the important 13.4K floor.
Dow Jones Industrials
Get your favorite symbols' Trend Analysis TODAY!


1 comment:
Investment in Nifty Market is also good, the free tips shared by you are profitable to earn more money. Thanks for this updates.
MCX India
Commodity Trading Tips India
Post a Comment