Dow dropped 91, decliners ahead of advancers 5-2 & NAZ fell 19. The Financial Index was 1+ to the 209s. The MLP index pulled back 2 to 401 & the REIT index fell fractionally to 262. Junk bonds funds edged higher & Treasuries were strong. The yield on the 10 year Treasury is down 30 basis points in the last 3 weeks. Oil headed for a 2nd weekly loss
(but flat today) on concern that slower economic growth will reduce demand & as
the OPEC secretary-
general said supplies are ample. Gold was slightly lower.


Photo: Bloomberg
US business activity unexpectedly contracted in Sep for the first time in 3 years, adding to signs manufacturing will contribute less to the economic recovery. The Institute for Supply Management said its business barometer fell 49.7 this month from 53 in Aug. A reading of 50 is the dividing line between expansion & contraction. Uncertainties surrounding domestic fiscal policy & weakening economies in Europe & China may prevent companies from adding to headcount & ramping up production. Slow growth prospects prompted the Federal Reserve to announce more accommodation measures earlier this month in a bid to help spur the 3-year-old expansion. The estimate was the gauge would fall to 52.8. One more negative sign about the health of the economy.
Americans boosted spending in Aug even though their income barely grew. Much of the spending increase went to pay higher gas prices, which may have forced consumers to cut back elsewhere. The Commerce Dept said that consumer spending rose 0.5% in Aug from Jul, the biggest jump since Feb. Still, the increase was driven by a 1.7% surge in purchases of nondurable goods, largely reflecting a sharp rise in gas prices during the month. Spending on durable goods rose 0.3%, helped by gains in auto sales. Spending on services rose just 0.2%. Income rose just 0.1%, reflecting the weak job growth. Taking into account inflation, after-tax incomes actually fell 0.3% in Aug, the poorest performance since Nov. High unemployment and weak wage growth have kept Americans from spending more freely, which has held back growth. The economy grew at an annual rate of 1.3% in Q2, down from the 2% growth rate in Q1 & far too weak to lower the unemployment rate at 8.1%. Earlier this month, the gov released a mixed report on retail spending that showed that consumers are feeling pinched by higher gas prices.
Consumer Spending in U.S. Stagnates

Photo: Bloomberg
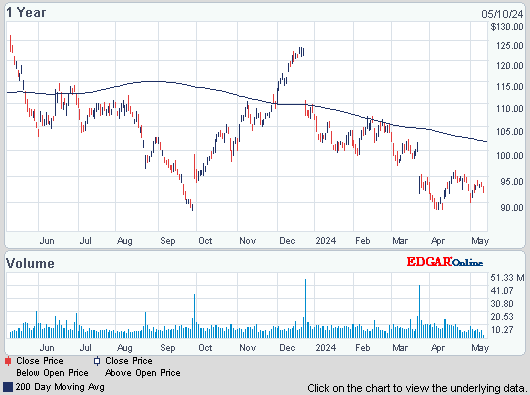
Nike declined the most in almost 3 months after reporting future orders that trailed estimates as demand sank in China. CEO Mark Parker has been discounting merchandise in China to clear inventory that wasn’t selling well, hurting demand for new products. Future orders from China, excluding currency fluctuations, declined 6%, trailing the average estimate for a 1.2% gain. Total orders for the Nike brand from Sep-Jan advanced 8%, trailing the 10% estimate. The economy in China “appears to be slowing, creating a short-term impact to any business operating there,” Charles Denson, president of the Nike brand, said. He declined to say when results in China would improve. EPS was $1.23 a share, down from $1.36 a year earlier. The projection was for $1.13. The profit drop was the 2nd straight decline after 9 straight quarterly gains. There is a significant glut of inventory in athletic apparel and footwear. A year ago, NKE orders for China rose 22%. While total revenue rose 9.7% to $6.67B, which also topped estimates, profitability was hurt by higher costs for labor & materials. Gross margin narrowed 0.8 percentage point to 43.5% from a year earlier, the 7th straight decline. The stock fell 1.63.

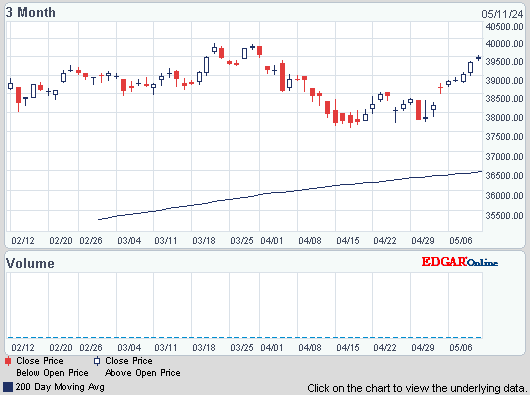
There were more signals that all is not well around the world. Europe is in a recession & Spain may be on the brink of asking for a bailout. China is doing a lot better than most other countries, but its growth is below what it would like to be. The US economy is soggy & these conditions are not going to get better before the elections, at a minimum. The fiscal cliff keeps getting closer & companies hesitate before expanding & hiring more workers. Dow is just below the technically important 13.4K floor. We'll see if that holds which would signal more troubling times ahead..

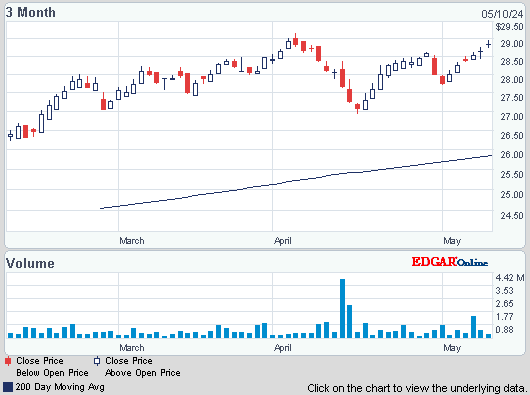
AMJ (Alerian MLP Index tracking fund)
Treasury yields:
U.S. 3-month |
0.091% | |
U.S. 2-year |
0.234% | |
U.S. 10-year |
1.613% |
| CLX12.NYM | ...Crude Oil Nov 12 | ...91.76 | ... | (0.1%) |
| GCV12.CMX | ...Gold Oct 12 | ......1,776.90 | ... | (0.0%) |
Get the latest daily market update below:

US business activity unexpectedly contracted in Sep for the first time in 3 years, adding to signs manufacturing will contribute less to the economic recovery. The Institute for Supply Management said its business barometer fell 49.7 this month from 53 in Aug. A reading of 50 is the dividing line between expansion & contraction. Uncertainties surrounding domestic fiscal policy & weakening economies in Europe & China may prevent companies from adding to headcount & ramping up production. Slow growth prospects prompted the Federal Reserve to announce more accommodation measures earlier this month in a bid to help spur the 3-year-old expansion. The estimate was the gauge would fall to 52.8. One more negative sign about the health of the economy.
Americans boosted spending in Aug even though their income barely grew. Much of the spending increase went to pay higher gas prices, which may have forced consumers to cut back elsewhere. The Commerce Dept said that consumer spending rose 0.5% in Aug from Jul, the biggest jump since Feb. Still, the increase was driven by a 1.7% surge in purchases of nondurable goods, largely reflecting a sharp rise in gas prices during the month. Spending on durable goods rose 0.3%, helped by gains in auto sales. Spending on services rose just 0.2%. Income rose just 0.1%, reflecting the weak job growth. Taking into account inflation, after-tax incomes actually fell 0.3% in Aug, the poorest performance since Nov. High unemployment and weak wage growth have kept Americans from spending more freely, which has held back growth. The economy grew at an annual rate of 1.3% in Q2, down from the 2% growth rate in Q1 & far too weak to lower the unemployment rate at 8.1%. Earlier this month, the gov released a mixed report on retail spending that showed that consumers are feeling pinched by higher gas prices.
Consumer Spending in U.S. Stagnates

Nike declined the most in almost 3 months after reporting future orders that trailed estimates as demand sank in China. CEO Mark Parker has been discounting merchandise in China to clear inventory that wasn’t selling well, hurting demand for new products. Future orders from China, excluding currency fluctuations, declined 6%, trailing the average estimate for a 1.2% gain. Total orders for the Nike brand from Sep-Jan advanced 8%, trailing the 10% estimate. The economy in China “appears to be slowing, creating a short-term impact to any business operating there,” Charles Denson, president of the Nike brand, said. He declined to say when results in China would improve. EPS was $1.23 a share, down from $1.36 a year earlier. The projection was for $1.13. The profit drop was the 2nd straight decline after 9 straight quarterly gains. There is a significant glut of inventory in athletic apparel and footwear. A year ago, NKE orders for China rose 22%. While total revenue rose 9.7% to $6.67B, which also topped estimates, profitability was hurt by higher costs for labor & materials. Gross margin narrowed 0.8 percentage point to 43.5% from a year earlier, the 7th straight decline. The stock fell 1.63.
Nike (NKE)
There were more signals that all is not well around the world. Europe is in a recession & Spain may be on the brink of asking for a bailout. China is doing a lot better than most other countries, but its growth is below what it would like to be. The US economy is soggy & these conditions are not going to get better before the elections, at a minimum. The fiscal cliff keeps getting closer & companies hesitate before expanding & hiring more workers. Dow is just below the technically important 13.4K floor. We'll see if that holds which would signal more troubling times ahead..
Dow Jones Industrials
Get your favorite symbols' Trend Analysis TODAY!


No comments:
Post a Comment