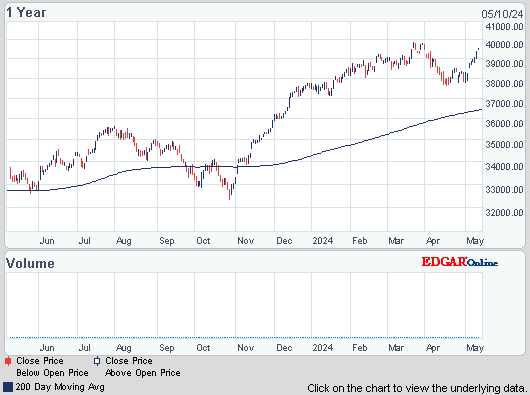
Dow advanced 188 closing at the highs, advancers over decliners 3-1 & NAZ jumped 45. The MLP index rose 3+ to the 459s & the REIT index went up 2 to the 273s. Junk bond funds gained ground & Treasuries pulled back bringing higher yields. Oil rose again but gold was little changed.
AMJ (Alerian MLP Index tracking fund)






![Live 24 hours gold chart [Kitco Inc.]](http://www.kitco.com/images/live/gold.gif)

Applications for unemployment benefits fell for the first time in 3 weeks as employers retained workers to meet demand. Jobless claims dropped 20K to 331K in the latest week, according to the Labor Dept. The forecast called for a decrease to 335K. The decline in dismissals shows employers are confident demand for goods & services will hold up at the same time fiscal restraints ease. A pickup in the pace of hiring & wage growth would help fuel bigger gains in the economy. The 4 week average of claims inched up to 334K from 333.75K in the prior week. The number continuing to receive jobless benefits rose 15K to 2.96M in the latest week. The unemployment rate among people eligible for benefits held at 2.3%.
Jobless Claims in U.S. Decreased 20,000 Last Week
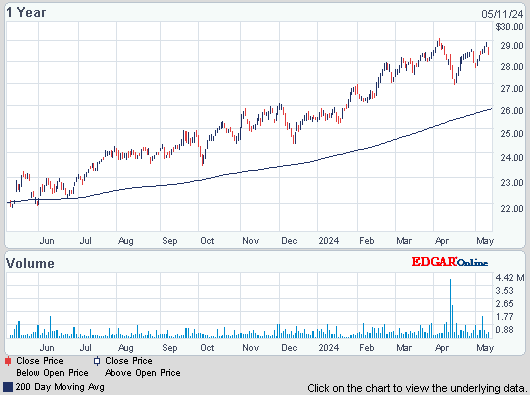
Prudential Financial posted Q4 results that missed the estimates as growth stalled at the intl operation. The net loss widened to $460M from $203M a year earlier. Operating profit per share, which excludes the results of policies sold before the firm went public & some investments, was $2.20, missing the $2.23 estimate. CEO John Strangfeld said PRU gets about half its profit from units outside the US, mainly in Japan. Costs to bolster reserves weighed on results at the intl business, which reported that profit was unchanged from a year earlier. Annualized new business premiums, a measure of sales, fell 38%. Prudential recorded $1.2B in costs tied to foreign exchange fluctuations, fueled by swings in the ¥. The Japanese currency weakened 18% last year against the dollar. But the company said the loss was cushioned by adjustments to other accounts that aren’t reflected in the net income figure. Adjusted operating profit was $647M at the intl insurance segment, as the Life Planner business recorded costs of $78M to increase reserves. Results were also hurt by $11M of costs to integrate units bought from AIG. Annualized new business premiums at the intl units were $683M, compared with $1.1B a year earlier. Prudential has raised prices for some products & stopped selling one form of life insurance in Japan. The stock dropped 47¢.
If you would like to learn more about PRU, click on this link:
http://club.ino.com/trend/?symb=PRU&a_aid=CD3289&a_bid=6ae5b6f7
Prudential Financial Misses Analyst Estimates as International Unit Stalls
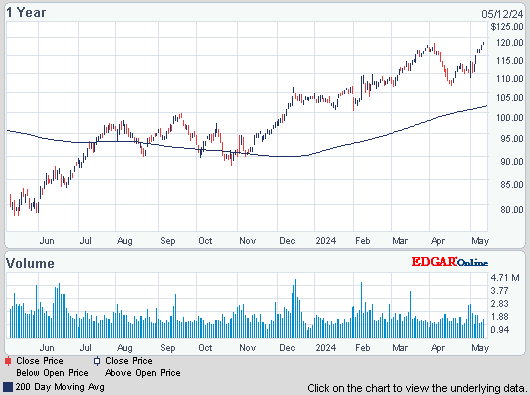
Allstate gained the most since Aug after profit beat the estimates. Q4 EPS more than doubled to $1.76. Operating profit, which excludes some investment results, was $1.70 a share, beating by 33¢ the estimate. Allstate spent 88.7¢ on claims & expenses for every premium dollar in its property & liability unit, compared with $1.02 in Q4-2012. Catastrophe costs in Q4-2013 fell to $117M from $1.06B. Q4-2012 included damages from Superstorm Sandy, which struck the East Coast in Oct causing $35B in insured losses industrywide, according to the Insurance Information Institute. The stock climbed 2.81.
If you would like to learn more about ALL, click on this link:
http://club.ino.com/trend/?symb=ALL&a_aid=CD3289&a_bid=6ae5b6f7
Allstate Rallies Most Since August as Profit Doubles, Exceeding Estimates
Stocks finally had an impressive day, the first of the year. However fundamentals driving selling this year have not disappeared. Financial problems around the globe are still weighing on the markets. While Argentina, Venezuela, Ukraine & Turkey have their troubles, China is the one that worries traders the most. Today's rally is coming ahead of tomorrow's jobs report for Jan. The response to that will show if this rally was another case of buy on the rumor & sell on the news.
Dow Jones Industrials
AMJ (Alerian MLP Index tracking fund)
Treasury yields:
U.S. 3-month |
0.07% | |
U.S. 2-year |
0.32% | |
U.S. 10-year |
2.70% |
| CLH14.NYM | ....Crude Oil Mar 14 | ....97.64 |  ...0.26 ...0.26 | (0.3%) |
Applications for unemployment benefits fell for the first time in 3 weeks as employers retained workers to meet demand. Jobless claims dropped 20K to 331K in the latest week, according to the Labor Dept. The forecast called for a decrease to 335K. The decline in dismissals shows employers are confident demand for goods & services will hold up at the same time fiscal restraints ease. A pickup in the pace of hiring & wage growth would help fuel bigger gains in the economy. The 4 week average of claims inched up to 334K from 333.75K in the prior week. The number continuing to receive jobless benefits rose 15K to 2.96M in the latest week. The unemployment rate among people eligible for benefits held at 2.3%.
Jobless Claims in U.S. Decreased 20,000 Last Week
Prudential Financial posted Q4 results that missed the estimates as growth stalled at the intl operation. The net loss widened to $460M from $203M a year earlier. Operating profit per share, which excludes the results of policies sold before the firm went public & some investments, was $2.20, missing the $2.23 estimate. CEO John Strangfeld said PRU gets about half its profit from units outside the US, mainly in Japan. Costs to bolster reserves weighed on results at the intl business, which reported that profit was unchanged from a year earlier. Annualized new business premiums, a measure of sales, fell 38%. Prudential recorded $1.2B in costs tied to foreign exchange fluctuations, fueled by swings in the ¥. The Japanese currency weakened 18% last year against the dollar. But the company said the loss was cushioned by adjustments to other accounts that aren’t reflected in the net income figure. Adjusted operating profit was $647M at the intl insurance segment, as the Life Planner business recorded costs of $78M to increase reserves. Results were also hurt by $11M of costs to integrate units bought from AIG. Annualized new business premiums at the intl units were $683M, compared with $1.1B a year earlier. Prudential has raised prices for some products & stopped selling one form of life insurance in Japan. The stock dropped 47¢.
If you would like to learn more about PRU, click on this link:
http://club.ino.com/trend/?symb=PRU&a_aid=CD3289&a_bid=6ae5b6f7
Prudential Financial Misses Analyst Estimates as International Unit Stalls
Prudential Financial (PRU)
Allstate gained the most since Aug after profit beat the estimates. Q4 EPS more than doubled to $1.76. Operating profit, which excludes some investment results, was $1.70 a share, beating by 33¢ the estimate. Allstate spent 88.7¢ on claims & expenses for every premium dollar in its property & liability unit, compared with $1.02 in Q4-2012. Catastrophe costs in Q4-2013 fell to $117M from $1.06B. Q4-2012 included damages from Superstorm Sandy, which struck the East Coast in Oct causing $35B in insured losses industrywide, according to the Insurance Information Institute. The stock climbed 2.81.
If you would like to learn more about ALL, click on this link:
http://club.ino.com/trend/?symb=ALL&a_aid=CD3289&a_bid=6ae5b6f7
Allstate Rallies Most Since August as Profit Doubles, Exceeding Estimates
Allstate (ALL)
Stocks finally had an impressive day, the first of the year. However fundamentals driving selling this year have not disappeared. Financial problems around the globe are still weighing on the markets. While Argentina, Venezuela, Ukraine & Turkey have their troubles, China is the one that worries traders the most. Today's rally is coming ahead of tomorrow's jobs report for Jan. The response to that will show if this rally was another case of buy on the rumor & sell on the news.
Dow Jones Industrials


I’m a huge fan of INO & from what I have seen so far, their service Marketclub! This isn’t a stripped down version, everything in MarketClub is available to you. I don’t want to give everything away, but you’ll have unlimited access to my favorite 3 tools: Trade Triangles, Smart Scan 7 Alerts!
The best part is that the MarketClub customer support team will be providing UNLIMITED support!
You can call or email for an instant response to any question, comment or concern.
Here’s that link:
https://club.ino.com/join/specialtrial/index_free.html?a_aid=CD3289&a_bid=359ef9a3
I’d recommend you jump on this now.