Dow dropped 42, decliners over advancers 2-1 & NAZ fell 11. The MLP index sank 5+ to the 451s & the REIT index lost 2 to the 279s. Junk bond funds were mixed & Treasuries did little. Oil was lower & gold headed for the biggest loss in
almost 3 weeks as the Federal Reserve (FED) fueled speculation that it will
trim stimulus measures sooner than expected.
AMJ (Alerian MLP Index tracking fund)
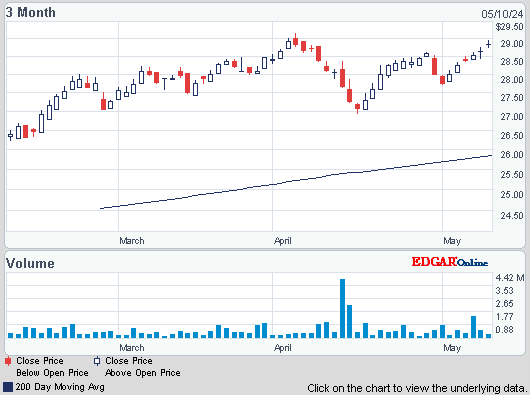
Photo: Yahoo
Jobless claims in the US declined last week after the impact of a gov shutdown on furloughed federal workers diminished. Initial claims for state benefits dropped 10K to 340K, according to the Labor Dept. Expectations were for applications to fall to 339K. The labor market has apparently slackened in recent months, with private-sector employers hiring fewer workers in Oct, after uncertainty caused by budget brinkmanship in DC dented consumer & business confidence. But the impact of earlier computer glitches worked its way out of the report. Other recent data on hiring, factory output & home sales in Sep had already suggested the economy lost a step even before the gov shut down. Readings on consumer confidence this month have shown the fiscal standoff rattled households. Claims filed by federal employees dropped 29K to 14K after the shutdown ended on Oct 17. In addition, California, which had been dealing with a backlog, reported no carryover in claims last week from previous weeks. The 4-week moving average for new claims increased 8K to 356K.
Jobless Claims in U.S. Drop as California Clears Backlog
Photo: Yahoo
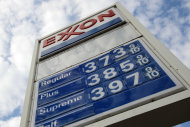
Exxon Mobil, a Dow stock & Dividend Aristocrat, quarterly profit fell 18% from last year, but it still made nearly $8B in Q3. Production increased slightly, but it made significantly less money at refining. EPS was $1.79 versus $2.09 a year earlier. Revenue dipped 2% to $112B. It was the 2nd-smallest quarterly profit since mid-2010, beating only this year's Q2 earnings of $6.86B. The results exceeded expectations of $1.77 on revenue of $107B. Earnings at the upstream business of finding & drilling for oil & gas improved, rising $740M to $6.7B. Production increased 1.5% because of new projects & fewer maintenance interruptions. But profits plunged in the "downstream" business of refining oil & selling the finished products. That segment earned $592M, down $2.6B from its record Q3 last year. Overcapacity in the refining industry has cut into margins. Profit from chemicals rose $235M to more than $1B. Capital & exploration spending increased 15% compared with a year earlier. CEO Rex Tillerson said XOM was making progress at tapping opportunities. "We maintain a long-term perspective on our business with a relentless focus on operational excellence and disciplined investing," Tillerson said. The company also spent $3B buying back 34M shares during Q3 & expects similar spending in Q4. The stock rose 63¢.
Exxon Boosts Production Amid Slumping Refining Margins
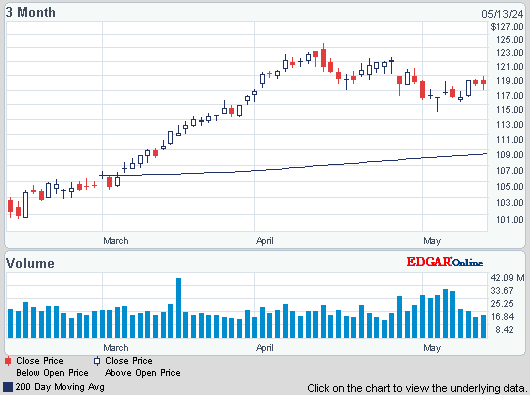

Photo: Bloomberg
Business activity expanded in Oct at the fastest pace since Mar 2011 as orders & production surged, indicating US manufacturing is gaining traction & will help fuel the economy. The MNI Chicago Report business barometer jumped to 65.9 from 55.7 in Sep, the biggest monthly increase in more than 3 decades. Readings above 50 signal expansion. The index exceeded the most optimistic estimate, in which the median projection was 55. A gauge of orders advanced to the highest level in 9 years. Demand strengthened thru the budget impasse that resulted in a partial federal gov shutdown for half the month. The 10.2-point surge was the biggest since Jul 1983. The index averaged 54.6 in 2012 & 62.8 in 2011.
Chicago Index Increases to Highest Since March 2011 on Orders
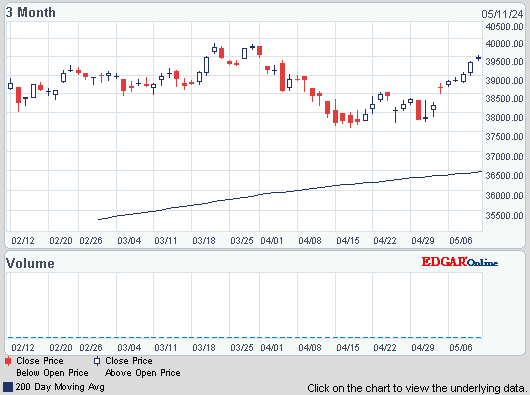
Today's decline is hardly significant as the Dow & S&P 500 are essentially at record highs after gaining around 20% YTD on mediocre economic news. Nervousness comes from worries that the Santa Claus FED will not keep giving away free money forever. Then the markets will have to pay more attention to earnings & economic reports. GDP data will be coming next Fri & expectations are for another drab number, the kind of data which markets have not been paying much attention to.
Dow Jones Industrials
AMJ (Alerian MLP Index tracking fund)
Treasury yields:
U.S. 3-month |
0.03% | |
U.S. 2-year |
0.31% | |
U.S. 10-year |
2.55% |
| CLZ13.NYM | ....Crude Oil Dec 13 | ...96.68 | (0.1%) |
| GCX13.CMX | ...Gold Nov 13 | .....1,321.80 | (2.0%) |
Photo: Yahoo
Jobless claims in the US declined last week after the impact of a gov shutdown on furloughed federal workers diminished. Initial claims for state benefits dropped 10K to 340K, according to the Labor Dept. Expectations were for applications to fall to 339K. The labor market has apparently slackened in recent months, with private-sector employers hiring fewer workers in Oct, after uncertainty caused by budget brinkmanship in DC dented consumer & business confidence. But the impact of earlier computer glitches worked its way out of the report. Other recent data on hiring, factory output & home sales in Sep had already suggested the economy lost a step even before the gov shut down. Readings on consumer confidence this month have shown the fiscal standoff rattled households. Claims filed by federal employees dropped 29K to 14K after the shutdown ended on Oct 17. In addition, California, which had been dealing with a backlog, reported no carryover in claims last week from previous weeks. The 4-week moving average for new claims increased 8K to 356K.
Jobless Claims in U.S. Drop as California Clears Backlog
Photo: Yahoo
Exxon Mobil, a Dow stock & Dividend Aristocrat, quarterly profit fell 18% from last year, but it still made nearly $8B in Q3. Production increased slightly, but it made significantly less money at refining. EPS was $1.79 versus $2.09 a year earlier. Revenue dipped 2% to $112B. It was the 2nd-smallest quarterly profit since mid-2010, beating only this year's Q2 earnings of $6.86B. The results exceeded expectations of $1.77 on revenue of $107B. Earnings at the upstream business of finding & drilling for oil & gas improved, rising $740M to $6.7B. Production increased 1.5% because of new projects & fewer maintenance interruptions. But profits plunged in the "downstream" business of refining oil & selling the finished products. That segment earned $592M, down $2.6B from its record Q3 last year. Overcapacity in the refining industry has cut into margins. Profit from chemicals rose $235M to more than $1B. Capital & exploration spending increased 15% compared with a year earlier. CEO Rex Tillerson said XOM was making progress at tapping opportunities. "We maintain a long-term perspective on our business with a relentless focus on operational excellence and disciplined investing," Tillerson said. The company also spent $3B buying back 34M shares during Q3 & expects similar spending in Q4. The stock rose 63¢.
Exxon Boosts Production Amid Slumping Refining Margins
Exxon Mobil (XOM)

Photo: Bloomberg
Business activity expanded in Oct at the fastest pace since Mar 2011 as orders & production surged, indicating US manufacturing is gaining traction & will help fuel the economy. The MNI Chicago Report business barometer jumped to 65.9 from 55.7 in Sep, the biggest monthly increase in more than 3 decades. Readings above 50 signal expansion. The index exceeded the most optimistic estimate, in which the median projection was 55. A gauge of orders advanced to the highest level in 9 years. Demand strengthened thru the budget impasse that resulted in a partial federal gov shutdown for half the month. The 10.2-point surge was the biggest since Jul 1983. The index averaged 54.6 in 2012 & 62.8 in 2011.
Chicago Index Increases to Highest Since March 2011 on Orders
Today's decline is hardly significant as the Dow & S&P 500 are essentially at record highs after gaining around 20% YTD on mediocre economic news. Nervousness comes from worries that the Santa Claus FED will not keep giving away free money forever. Then the markets will have to pay more attention to earnings & economic reports. GDP data will be coming next Fri & expectations are for another drab number, the kind of data which markets have not been paying much attention to.
Dow Jones Industrials





No comments:
Post a Comment