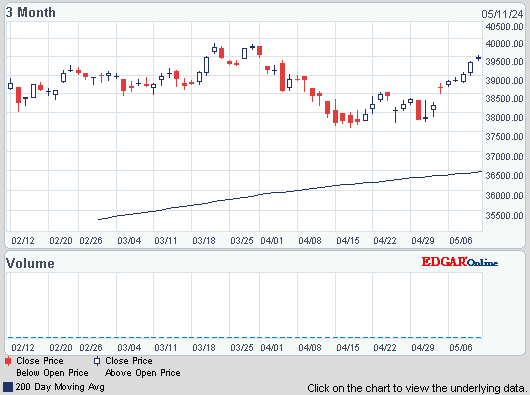
Dow went up 84, advancers ahead of decliners 5-4 & NAZ added 19. The MLP index rose 2+ to the 461s & the REIT index slipped fractionally to 284. Junk bond funds were generally higher & Treasuries slid back. Oil fell to a 4 month low & gold found buyers from uncertainty about fiscal policy in DC.
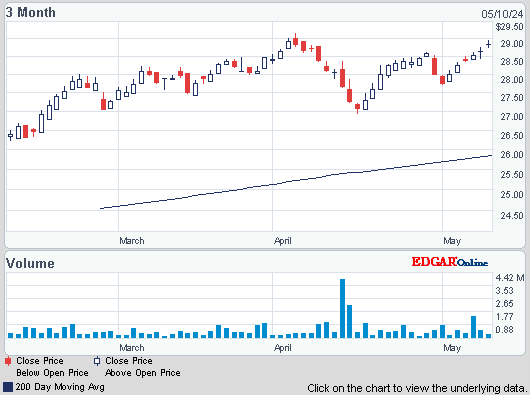
AMJ (Alerian MLP Index tracking fund)


Photo: Bloomberg
More Americans than forecast filed applications for unemployment benefits last week as California continued to work thru a backlog. Jobless claims decreased 12K to 350K from a revised 362K in the prior period, according to the Labor Dept. The forecast called for a decrease to 340K. Applications in California remained elevated & analysts weren’t able to determine how many non-federal workers filed due to the gov shutdown, a Labor Dept spokesman said. Layoffs may gradually diminish as a backlog of claims processing in California work their way out of the data & the end to the closure of gov prompts companies to call back staff. A slower-than-expected pace of hiring in Sep may reflect companies’ hesitance to ramp up payrolls as lawmakers in DC feuded over the budget & now prepare for the next round of negotiations. Federal workers filed about 44K claims for jobless benefits 2 weeks ago, down from about 70K the prior period. Those were tallied in a separate category & didn’t influence the headline reading.
More Americans Than Forecast Filed Jobless Claims
The trade deficit in the US was little changed in Aug as imports & exports stalled, indicating a loss of momentum in global economic growth. The gap increased 0.4% to $38.8 B from a revised $38.6B in Jul that was smaller than previously reported, according to the Commerce Dept. The forecast called for a $39.4B deficit. Overseas economies that are struggling to gain traction & fiscal gridlock in the US are probably holding back consumer spending heading into the holiday season, slowing imports. At the same time, the report showed imports of capital goods climbed to the highest level in more than a year, indicating companies were looking to invest in new equipment before the partial gov shutdown.
Trade Gap in U.S. Little Changed as Exports, Imports Stall

Photo: Bloomberg
Ford Q3 profit beat estimates & boosted its outlook for the year on rising demand for F-Series pickups in North America & progress with shrinking losses in Europe. EPS excluding one-time items was 45¢, exceeding the 37¢ estimate. The #2 US carmaker raised its forecasts for total company pretax profit & operating margin for the full year. “The breadth and the depth and the quality of the growth is very exciting for us,” CFO Bob Shanks said. The company’s vehicle deliveries, revenue & market share increased in all four of its regions. The results show that CEO Alan Mulally’s turnaround is advancing & lessened concern that the company would suffer should he leave early. Ford has turned around by broadening its lineup with more competitive cars & expanding its presence in markets such as China. Ford said it now expects total company pretax profit & automotive operating margin to be higher than last year. The company previously said profit would be about equal or higher & margin would be about equal or lower. In Europe, Ford now forecasts a full-year loss of less than $1.8B, a smaller deficit than it previously estimated. Q3 EPS compared with 40¢, excluding some items, & 41¢ a year earlier. Ford earned a $2.3B in North America. Its Q3 operating margin of 10.6% in the region compares with 12% a year earlier. The stock gained a quarter.
Ford Raises Outlook on Europe Progress After Profit Beat

Not a lot getting done in the markets today. But buyers are flexing their muscles, bringing higher prices. Dow is within 150 of reaching a new high even though earnings to get mixed reviews. High yielding sectors have already seen more than their fair share of selling.
Dow Jones Industrials

AMJ (Alerian MLP Index tracking fund)
Treasury yields:
U.S. 3-month |
0.04% | |
U.S. 2-year |
0.30% | |
U.S. 10-year |
2.50% |
| CLZ13.NYM | ....Crude Oil Dec 13 | ...96.12 | (0.8%) |
| GCV13.CMX | ...Gold Oct 13 | ......1,340.00 | (0.5%) |

Photo: Bloomberg
More Americans than forecast filed applications for unemployment benefits last week as California continued to work thru a backlog. Jobless claims decreased 12K to 350K from a revised 362K in the prior period, according to the Labor Dept. The forecast called for a decrease to 340K. Applications in California remained elevated & analysts weren’t able to determine how many non-federal workers filed due to the gov shutdown, a Labor Dept spokesman said. Layoffs may gradually diminish as a backlog of claims processing in California work their way out of the data & the end to the closure of gov prompts companies to call back staff. A slower-than-expected pace of hiring in Sep may reflect companies’ hesitance to ramp up payrolls as lawmakers in DC feuded over the budget & now prepare for the next round of negotiations. Federal workers filed about 44K claims for jobless benefits 2 weeks ago, down from about 70K the prior period. Those were tallied in a separate category & didn’t influence the headline reading.
More Americans Than Forecast Filed Jobless Claims
The trade deficit in the US was little changed in Aug as imports & exports stalled, indicating a loss of momentum in global economic growth. The gap increased 0.4% to $38.8 B from a revised $38.6B in Jul that was smaller than previously reported, according to the Commerce Dept. The forecast called for a $39.4B deficit. Overseas economies that are struggling to gain traction & fiscal gridlock in the US are probably holding back consumer spending heading into the holiday season, slowing imports. At the same time, the report showed imports of capital goods climbed to the highest level in more than a year, indicating companies were looking to invest in new equipment before the partial gov shutdown.
Trade Gap in U.S. Little Changed as Exports, Imports Stall

Photo: Bloomberg
Ford Q3 profit beat estimates & boosted its outlook for the year on rising demand for F-Series pickups in North America & progress with shrinking losses in Europe. EPS excluding one-time items was 45¢, exceeding the 37¢ estimate. The #2 US carmaker raised its forecasts for total company pretax profit & operating margin for the full year. “The breadth and the depth and the quality of the growth is very exciting for us,” CFO Bob Shanks said. The company’s vehicle deliveries, revenue & market share increased in all four of its regions. The results show that CEO Alan Mulally’s turnaround is advancing & lessened concern that the company would suffer should he leave early. Ford has turned around by broadening its lineup with more competitive cars & expanding its presence in markets such as China. Ford said it now expects total company pretax profit & automotive operating margin to be higher than last year. The company previously said profit would be about equal or higher & margin would be about equal or lower. In Europe, Ford now forecasts a full-year loss of less than $1.8B, a smaller deficit than it previously estimated. Q3 EPS compared with 40¢, excluding some items, & 41¢ a year earlier. Ford earned a $2.3B in North America. Its Q3 operating margin of 10.6% in the region compares with 12% a year earlier. The stock gained a quarter.
Ford Raises Outlook on Europe Progress After Profit Beat
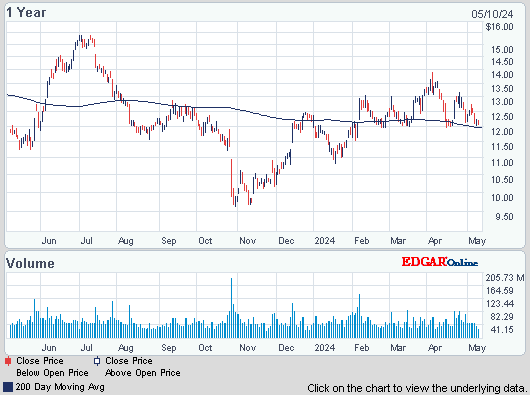
Ford (F)
Not a lot getting done in the markets today. But buyers are flexing their muscles, bringing higher prices. Dow is within 150 of reaching a new high even though earnings to get mixed reviews. High yielding sectors have already seen more than their fair share of selling.
Dow Jones Industrials


No comments:
Post a Comment