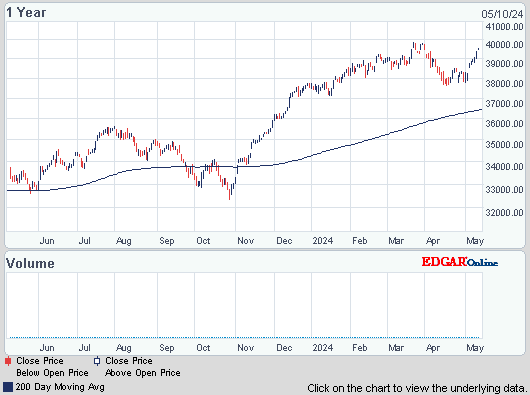
Dow fell 73 (closing at the low), decliners over advancers 3-2 & NAZ fell 10. The MLP index lost 2+ to the 455s & the REIT index fell 2 to the 279s. Junk bond funds fluctuated & Treasuries drifted lower. Oil was off while gold dropped 25.
AMJ (Alerian MLP Index tracking fund)
![Live 24 hours gold chart [Kitco Inc.]](http://www.kitco.com/images/live/gold.gif)

The Organization of Petroleum Exporting Countries (OPEC) will cut crude exports thru mid-Nov as rising US output allows the nation to curb purchases from the MidEast & Africa &, according to Oil Movements. OPEC, which supplies about 40% of the world’s oil, will reduce sailings by 80K barrels a day, or 0.3%, to 23.78M barrels in the 4 weeks to Nov 16. That compares with 23.86M in the period to Oct 19. The figures exclude 2 of OPEC’s 12 members, Angola & Ecuador. “There’s a lot of non-OPEC supply coming to the market” from the US & the North Sea, Roy Mason, the company’s founder, said. OPEC shipments are “weak because of American production,” he said. OPEC exports are set to increase in H2-2014 as heating demand rises before winter in the northern hemisphere, Mason said. MidEast shipments will fall 0.7% to 17.43M barrels a day in the month to Nov 16, versus 17.56M in the previous period, according to Oil Movements. Those figures include non-OPEC nations Oman & Yemen. Crude on board tankers will decline by about 6% to 462M barrels on Nov 16. The researcher calculates volumes by tallying tanker bookings & excludes crude held on vessels for storage.
OPEC Exports to Drop as U.S. Output Gains, Oil Movements Says
Clorox 1st-quarter net income rises 2 percent Associated Press
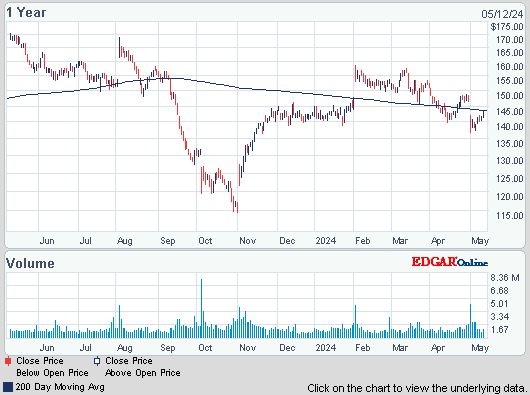

Photo: Bloomberg
Avon fell the most in 5 years after posting a Q3 net loss & saying possible fines related to foreign bribery probes may materially hurt earnings. The SEC offered a settlement last month with monetary penalties that were “significantly greater” than the $12M the company had offered, Avon said. Should the Justice Dept offer similar terms, earnings, cash flow & ongoing business would be “materially adversely impacted,” the company said. “Monetary penalties at the level proposed by the SEC staff are not warranted,” AVP said, without giving details. AVP & the gov have investigated whether former employees in China & other countries bribed officials in violation of the Foreign Corrupt Practices Act. In regulatory filings in 2011, AVP disclosed the firing of 4 executives suspected of paying bribes in China. “The third quarter was tough,” CEO Sheri McCoy said. “Our quarterly performance was negatively impacted by macroeconomic headwinds and continued weakness in some parts of our business, particularly North America.” The net loss was a penny a share, compared with EPS of 7¢ a year earlier. Excluding some items, EPS was 14¢, below the forecast of 19¢. Revenue fell 7.5% to $2.32B, trailing the $2.44B estimate. North American sales slid 19% to $328.6M as the number of active sales representatives slid. The stock plunged 4.90 (22%).
Avon Falls on Third-Quarter Loss, SEC Bribe Fine Dispute

Stocks have lost their way after the 2 major averages set new record highs this week. Dow is down 25. Maybe economic reality is setting in. Q3 earnings have not been impressive. As has been the case for some time, earnings gains generally did not come from from higher revenue. They tended to be attributable to this & that accounting adjustments. Earnings from retailers are due in a couple of weeks & they may not be pretty. Then there is dysfunctional DC. More showdowns are coming on funding the federal gov & raising the debt ceiling. The stock market is saying, "What, me worry?" I don't know about that.
Dow Jones Industrials
AMJ (Alerian MLP Index tracking fund)
Treasury yields:
U.S. 3-month |
0.04% | |
U.S. 2-year |
0.30% | |
U.S. 10-year |
2.54% |
| CLZ13.NYM | ....Crude Oil Dec 13 | ....96.73 | (0.0%) |
![Live 24 hours gold chart [Kitco Inc.]](http://www.kitco.com/images/live/gold.gif)

The Organization of Petroleum Exporting Countries (OPEC) will cut crude exports thru mid-Nov as rising US output allows the nation to curb purchases from the MidEast & Africa &, according to Oil Movements. OPEC, which supplies about 40% of the world’s oil, will reduce sailings by 80K barrels a day, or 0.3%, to 23.78M barrels in the 4 weeks to Nov 16. That compares with 23.86M in the period to Oct 19. The figures exclude 2 of OPEC’s 12 members, Angola & Ecuador. “There’s a lot of non-OPEC supply coming to the market” from the US & the North Sea, Roy Mason, the company’s founder, said. OPEC shipments are “weak because of American production,” he said. OPEC exports are set to increase in H2-2014 as heating demand rises before winter in the northern hemisphere, Mason said. MidEast shipments will fall 0.7% to 17.43M barrels a day in the month to Nov 16, versus 17.56M in the previous period, according to Oil Movements. Those figures include non-OPEC nations Oman & Yemen. Crude on board tankers will decline by about 6% to 462M barrels on Nov 16. The researcher calculates volumes by tallying tanker bookings & excludes crude held on vessels for storage.
OPEC Exports to Drop as U.S. Output Gains, Oil Movements Says
Clorox, a Dividend Aristocrat, fiscal Q1 net income rose 2%,
beating expectations, on higher sales for its Burt's Bees
cosmetics, charcoal & laundry products as well as cleaning products
for medical professionals. But the consumer products company also lowered its full-year guidance, citing weaker sales & higher costs. "We continue to face headwinds, including foreign currency
declines and increasing commodity costs," said CEO Don Knauss. "We're also facing heightened competitive activity, which we
expect to continue through the fiscal year." Increased competition, for example, drove shipments of its disinfecting wipes lower. There was growth elsewhere. Burt's Bees delivered
"double-digit volume growth" thanks to new lip products & higher
demand for the brand's face products & shipments of charcoal were strong
during the summer. EPS was $1.03 which compares to $1.01 in the same qtr a year ago. Revenue rose 2% to
$1.36B from $1.34B a year ago. Expectations were for EPS of $1 on revenue of $1.35B. For the fiscal full year, which ends June 2014, CLX expects EPS of $4.45-$4.60,
down from its previous forecast of $4.55-$4.70. Analysts are expecting $4.57. It now expects revenue to rise 2-3% after giving previous guidance of 2-4%. Based on fiscal 2013 revenue of
$5.62B, that would mean fiscal 2014 revenue would be
$5.73-$5.79B. Analysts expected $5.75B. The stock was up a nickel.
Clorox 1st-quarter net income rises 2 percent Associated Press
Clorox (CLX)

Photo: Bloomberg
Avon fell the most in 5 years after posting a Q3 net loss & saying possible fines related to foreign bribery probes may materially hurt earnings. The SEC offered a settlement last month with monetary penalties that were “significantly greater” than the $12M the company had offered, Avon said. Should the Justice Dept offer similar terms, earnings, cash flow & ongoing business would be “materially adversely impacted,” the company said. “Monetary penalties at the level proposed by the SEC staff are not warranted,” AVP said, without giving details. AVP & the gov have investigated whether former employees in China & other countries bribed officials in violation of the Foreign Corrupt Practices Act. In regulatory filings in 2011, AVP disclosed the firing of 4 executives suspected of paying bribes in China. “The third quarter was tough,” CEO Sheri McCoy said. “Our quarterly performance was negatively impacted by macroeconomic headwinds and continued weakness in some parts of our business, particularly North America.” The net loss was a penny a share, compared with EPS of 7¢ a year earlier. Excluding some items, EPS was 14¢, below the forecast of 19¢. Revenue fell 7.5% to $2.32B, trailing the $2.44B estimate. North American sales slid 19% to $328.6M as the number of active sales representatives slid. The stock plunged 4.90 (22%).
Avon Falls on Third-Quarter Loss, SEC Bribe Fine Dispute
Avon (AVP)
Stocks have lost their way after the 2 major averages set new record highs this week. Dow is down 25. Maybe economic reality is setting in. Q3 earnings have not been impressive. As has been the case for some time, earnings gains generally did not come from from higher revenue. They tended to be attributable to this & that accounting adjustments. Earnings from retailers are due in a couple of weeks & they may not be pretty. Then there is dysfunctional DC. More showdowns are coming on funding the federal gov & raising the debt ceiling. The stock market is saying, "What, me worry?" I don't know about that.
Dow Jones Industrials
I’m a huge fan of INO, & from what I have seen so far, their service Marketclub! This isn’t a stripped down version, everything in MarketClub is available to you. I don’t want to give everything away, but you’ll have unlimited access to my favorite three tools: Trade Triangles, Smart Scan, & Alerts! The best part is that the MarketClub customer support team will be providing UNLIMITED support! You can call or email for an instant response to any question, comment or concern.
Here’s that link:
https://club.ino.com/join/specialtrial/index_free.html?a_aid=CD3289&a_bid=359ef9a3
I’ll get you more info a little bit later, but I’d recommend you jump on this now.


