Dow jumped 93, advancers over decliners a meager 5-4 & NAZ rose 21. The MLP index was off 1+ to 448 & the REIT index added a fraction to 284. Junk bond funds were mixed to lower & Treasuries were flat. Oil traded
near the highest price in more than 4 months before a
gov report that will probably show US stockpiles
declined as refinery processing increased. Gold fell to a one-week low as the
Federal Reserve starts a policy meeting that may provide
information about when the central bank will start slowing the
pace of its stimulus.
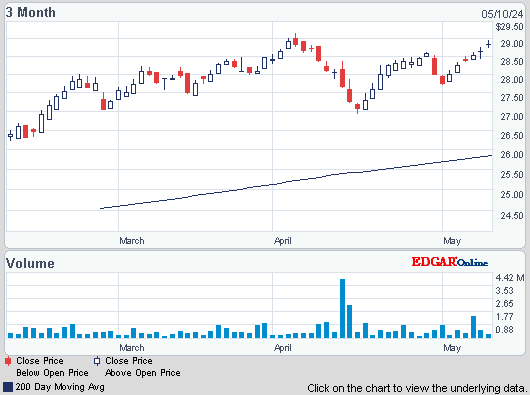
AMJ (Alerian MLP Index tracking fund)


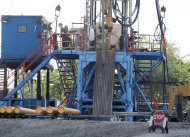
Photo: Bloomberg
Housing starts rose less than expected in May, likely reflecting labor & material constraints, but the overall trend remained consistent with strength in the housing market. Though permits for future home construction fell, that followed a surge in Apr, which hoisted them above the 1M mark. The pullback last month reflected a drop in the volatile multi-family sector, but permits for single-family construction touched their highest level in 5 years. The Commerce Dept said housing starts rose 6.8% to an annual rate of 914K units. Starts in Apr were revised up to show a 856K unit pace instead of the previously reported 853K units. Expectations were for groundbreaking to rise to a 950K unit rate. Builders, who are ramping up construction to meet demand for housing against the backdrop very low inventory, have been complaining about labor shortages & increased material costs. Though residential construction only accounts for about 2.5% of GDP, housing has a wider reach on the economy. Analysts estimate that for every single-family home built, at least 3 jobs lasting for a year are created. Starts are expected to top a 1M pace this year. Last month, groundbreaking for single-family homes, the largest segment of the market, rose 0.3% to a 599K pace & starts for multi-family homes increased 21.6% to a 315K rate. Permits to build homes fell 3.1% to a 974K pace. Permits for multi-family homes dropped 10% to a 352K annual rate. But permits for single-family homes rose 1.3% to a 622K units, the highest since May 2008.
Housing Starts in U.S. Rose in May to 914,000 Annual Rate

Photo: Yahoo
US consumer prices rose slightly in May as higher energy costs were partly offset by cheaper food. The small increase comes after 2 straight declines, underscoring that American consumers are benefiting from mild inflation. The CPI ticked up 0.1%, only the 2nd increase in 7 months, according to the Labor Dept. Consumer prices fell 0.4% in Apr, the largest decline in 4 years. In the past 12 months, prices have increased just 1.4%, up from a 1.1% annual pace in Apr (which was the smallest in 2½ years). Slow economic growth & high unemployment have kept wages from rising quickly making it harder for retailers & other firms to raise prices. In May, higher natural gas & electricity costs pushed up energy prices 0.4% while gas prices were flat. Food costs fell 0.1%, as grocery prices dropped by the most in almost 4 years. Outside the volatile food & gas categories, core prices rose 0.2%, driven up by higher rents & rising prices for hotels, clothing & air fares. Core prices have increased 1.7% in the past 12 months, in line with the Federal Reserve's inflation target of 2%. The cost of health care is rising at a much slower pace than its historical norm, helping to limit inflation. In the past 12 months, overall health care prices rose just 2.2%, the smallest yearly increase for that category in more than 40 years.
Consumer Prices in U.S. Increased Less Than Forecast in May

Photo: Bloomberg
Private nonresidential construction is losing steam in the US, a sign that commercial real estate may be a drag on the economy as business leaders are reluctant to make large property investments. Spending on lodging, office, commercial & manufacturing buildings grew 5.6% in Apr to about $11B from a year ago, the slowest pace in almost 2 years, according to the Census Bureau show. 4 years into the economic expansion, “we’d expect to see more lasting signs of strength,” said Kermit Baker, chief economist for the American Institute of Architects. “That hasn’t happened yet.” Normally, this type of construction exhibits “late-cycle” growth because the design and building process may take several years, so business leaders need to be confident that a durable recovery is well under way before undertaking a project, Baker said. Activity has been “unusually volatile” since the 18-month recession ended in Jun 2009, with “only brief flashes of growth.” Investment in private nonresidential structures subtracted 0.11 percentage point from GDP in Q1, while homebuilding added 0.3 percentage point, according to Commerce Dept figures. The weakness may persist, judging by the Architecture Billings Index, a monthly survey of US based architecture firms that serves as a “good, solid leading indicator” of nonresidential construction nine to 12 months down the road, Baker said. The commercial & industrial component of this index fell to 49.2 in April, the lowest level in 7 months.
The bulls are taking control of the stock market again, after a one month resting period. All news is treated as good news. But the breadth is weak while traders are waiting to hear from Big Ben. His words about the future of stimulus spending will move the market. Until then, all we can do is await developments.
Dow Jones Industrials

AMJ (Alerian MLP Index tracking fund)
Treasury yields:
U.S. 3-month |
0.00% | |
U.S. 2-year |
0.27% | |
U.S. 10-year |
2.19% |
| CLX13.NYM | ...Crude Oil Nov 13 | ...97.60 | (0.2%) |
| GCN13.CMX | ...Gold Jul 13 | ........1,366.60 | (1.2%) |

Photo: Bloomberg
Housing starts rose less than expected in May, likely reflecting labor & material constraints, but the overall trend remained consistent with strength in the housing market. Though permits for future home construction fell, that followed a surge in Apr, which hoisted them above the 1M mark. The pullback last month reflected a drop in the volatile multi-family sector, but permits for single-family construction touched their highest level in 5 years. The Commerce Dept said housing starts rose 6.8% to an annual rate of 914K units. Starts in Apr were revised up to show a 856K unit pace instead of the previously reported 853K units. Expectations were for groundbreaking to rise to a 950K unit rate. Builders, who are ramping up construction to meet demand for housing against the backdrop very low inventory, have been complaining about labor shortages & increased material costs. Though residential construction only accounts for about 2.5% of GDP, housing has a wider reach on the economy. Analysts estimate that for every single-family home built, at least 3 jobs lasting for a year are created. Starts are expected to top a 1M pace this year. Last month, groundbreaking for single-family homes, the largest segment of the market, rose 0.3% to a 599K pace & starts for multi-family homes increased 21.6% to a 315K rate. Permits to build homes fell 3.1% to a 974K pace. Permits for multi-family homes dropped 10% to a 352K annual rate. But permits for single-family homes rose 1.3% to a 622K units, the highest since May 2008.
Housing Starts in U.S. Rose in May to 914,000 Annual Rate

Photo: Yahoo
US consumer prices rose slightly in May as higher energy costs were partly offset by cheaper food. The small increase comes after 2 straight declines, underscoring that American consumers are benefiting from mild inflation. The CPI ticked up 0.1%, only the 2nd increase in 7 months, according to the Labor Dept. Consumer prices fell 0.4% in Apr, the largest decline in 4 years. In the past 12 months, prices have increased just 1.4%, up from a 1.1% annual pace in Apr (which was the smallest in 2½ years). Slow economic growth & high unemployment have kept wages from rising quickly making it harder for retailers & other firms to raise prices. In May, higher natural gas & electricity costs pushed up energy prices 0.4% while gas prices were flat. Food costs fell 0.1%, as grocery prices dropped by the most in almost 4 years. Outside the volatile food & gas categories, core prices rose 0.2%, driven up by higher rents & rising prices for hotels, clothing & air fares. Core prices have increased 1.7% in the past 12 months, in line with the Federal Reserve's inflation target of 2%. The cost of health care is rising at a much slower pace than its historical norm, helping to limit inflation. In the past 12 months, overall health care prices rose just 2.2%, the smallest yearly increase for that category in more than 40 years.
Consumer Prices in U.S. Increased Less Than Forecast in May

Photo: Bloomberg
Private nonresidential construction is losing steam in the US, a sign that commercial real estate may be a drag on the economy as business leaders are reluctant to make large property investments. Spending on lodging, office, commercial & manufacturing buildings grew 5.6% in Apr to about $11B from a year ago, the slowest pace in almost 2 years, according to the Census Bureau show. 4 years into the economic expansion, “we’d expect to see more lasting signs of strength,” said Kermit Baker, chief economist for the American Institute of Architects. “That hasn’t happened yet.” Normally, this type of construction exhibits “late-cycle” growth because the design and building process may take several years, so business leaders need to be confident that a durable recovery is well under way before undertaking a project, Baker said. Activity has been “unusually volatile” since the 18-month recession ended in Jun 2009, with “only brief flashes of growth.” Investment in private nonresidential structures subtracted 0.11 percentage point from GDP in Q1, while homebuilding added 0.3 percentage point, according to Commerce Dept figures. The weakness may persist, judging by the Architecture Billings Index, a monthly survey of US based architecture firms that serves as a “good, solid leading indicator” of nonresidential construction nine to 12 months down the road, Baker said. The commercial & industrial component of this index fell to 49.2 in April, the lowest level in 7 months.
The bulls are taking control of the stock market again, after a one month resting period. All news is treated as good news. But the breadth is weak while traders are waiting to hear from Big Ben. His words about the future of stimulus spending will move the market. Until then, all we can do is await developments.
Dow Jones Industrials


No comments:
Post a Comment