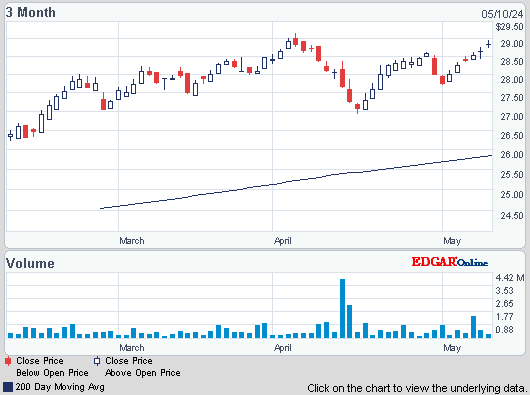
Dow dropped 123, decliners over advncers 4-1 & NAZ lost 36. The MLP index fell 1+ to the 445s & the REIT index was off fractionally to the 276s. Junk bond funds were lower & Treasuries were a little weak. Oil & gold followed stocks lower.
AMJ (Alerian MLP Index tracking fund)


Photo: Yahoo
The US trade deficit narrowed sharply in Jun to its lowest level in more than 3½ years as imports fell & exports touched a record high, suggesting an upward revision to Q2 growth. The Commerce Dept said the trade gap fell 22.4% to $34B, the smallest since Oct 2009. The percentage decline was the largest since Feb 2009. May's shortfall on the trade balance was revised to $44B from the previously reported $45B. The forecast was for it to narrow only to $43.5B. When adjusted for inflation, the trade gap narrowed to $43B, the smallest since Jan 2010, from $52B in May. The smaller real trade deficit in Jun suggests the gov could raise its initial Q2 GDP growth estimate published last week. Trade subtracted 0.8 percentage point from growth, according to the first estimate. Belt-tightening in DC & weaker global demand weighed on the US economy in the H1, but activity is expected to regain momentum for the rest of 2013 as the fiscal policy burden eases & if growth in Europe picks up. The 3-month moving average of the trade deficit fell to $39.5B in the 3 months to Jun from $40.5B in the prior period. Jun imports of goods & services fell 2.5% to $225B, reflecting hefty declines in petroleum imports & industrial supplies & materials, which tumbled to levels last seen in Nov 2010. Exports increased 2.2% to a record $191B. The gain in exports was broad based, with food, industrial supplies, capital goods & consumer goods rising. Motor vehicle exports, however, fell in Jun.
US employers in Jun advertised the most jobs in 5 years but hired fewer workers, a mixed sign for the recovering job market. The Labor Dept says job openings rose 29K in Jun from May to 3.94M. Total hiring, however, declined 289K to 4.2M, down from a year earlier & the biggest one-month drop since Jun 2010. The report on Job Openings & Labor Turnover comes after the gov said employers added 162K jobs in Jul, the fewest in 4 months. Last week's report showed all jobs added, minus the number of people who were laid off, quit or retired. Competition for jobs remains tight. In Jun, there were 3 unemployed people for every job opening. In a healthy economy, that ratio is typically 2 to 1.
US job openings rise in June, but hiring falls Associated Press

Photo: Yahoo
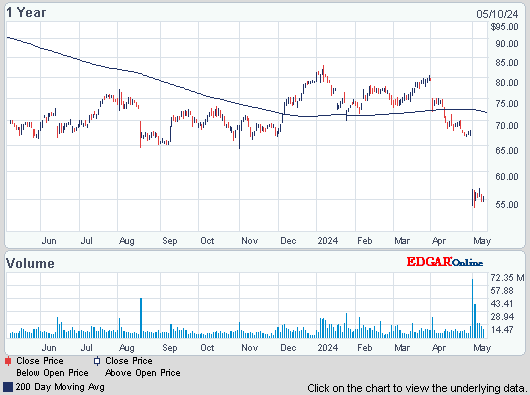
CVS Caremark Q2 profit rose slightly more than expected, as profit growth at the pharmacy benefits management unit outpaced its drugstores. The company also narrowed its 2013 EPS forecast,, bringing the bottom of the range up by a penny & the top down by 4¢ cents, citing share repurchases largely coming in H2 & its results so far. New generic drugs weighed on sales but helped profits. Generic drugs sell for less than branded ones but are more profitable. EPS was 91¢, up from 75¢ a year earlier. Adjusted EPS from continuing operations rose to 97¢ from 81¢, topping the estimate of 96¢. Revenue was up 1.7% to $31.2B. Operating profit jumped 32% in the pharmacy benefits management business & 9% in the retail business. The company said it has repurchased $748M shares & has plans to buy back $4B in stock this year. CVS now expects adjusted EPS of $3.90-$3.96 this year, with EPS of $1-$1.03 in Q3. Analysts expect full-year EPS of $3.98, with 97¢ this quarter. The stock fell 1.86.

This is another quiet day in the markets, not a lot going on. The drop looks big but Dow is up more than 1K in more than a month. It needs time to rest. Getting little attention are the goings on in DC because everybody left town for a long summer break. When they get back next month, they will have to deal with funding the gov & raising the debt ceiling. The debt ceiling mess has not gone away, just postponed because the federal deficit has narowed to "only" 750B (what would have been a record a few years ago).
AMJ (Alerian MLP Index tracking fund)
Treasury yields:
U.S. 3-month |
0.05% | |
U.S. 2-year |
0.31% | |
U.S. 10-year |
2.66% |
| CLU13.NYM | ...Crude Oil Sep 13 | ...106.13 | (0.4%) |
| GCQ13.CMX | ...Gold Aug 13 | .......1,280.70 | (1.7%) |

Photo: Yahoo
The US trade deficit narrowed sharply in Jun to its lowest level in more than 3½ years as imports fell & exports touched a record high, suggesting an upward revision to Q2 growth. The Commerce Dept said the trade gap fell 22.4% to $34B, the smallest since Oct 2009. The percentage decline was the largest since Feb 2009. May's shortfall on the trade balance was revised to $44B from the previously reported $45B. The forecast was for it to narrow only to $43.5B. When adjusted for inflation, the trade gap narrowed to $43B, the smallest since Jan 2010, from $52B in May. The smaller real trade deficit in Jun suggests the gov could raise its initial Q2 GDP growth estimate published last week. Trade subtracted 0.8 percentage point from growth, according to the first estimate. Belt-tightening in DC & weaker global demand weighed on the US economy in the H1, but activity is expected to regain momentum for the rest of 2013 as the fiscal policy burden eases & if growth in Europe picks up. The 3-month moving average of the trade deficit fell to $39.5B in the 3 months to Jun from $40.5B in the prior period. Jun imports of goods & services fell 2.5% to $225B, reflecting hefty declines in petroleum imports & industrial supplies & materials, which tumbled to levels last seen in Nov 2010. Exports increased 2.2% to a record $191B. The gain in exports was broad based, with food, industrial supplies, capital goods & consumer goods rising. Motor vehicle exports, however, fell in Jun.
US employers in Jun advertised the most jobs in 5 years but hired fewer workers, a mixed sign for the recovering job market. The Labor Dept says job openings rose 29K in Jun from May to 3.94M. Total hiring, however, declined 289K to 4.2M, down from a year earlier & the biggest one-month drop since Jun 2010. The report on Job Openings & Labor Turnover comes after the gov said employers added 162K jobs in Jul, the fewest in 4 months. Last week's report showed all jobs added, minus the number of people who were laid off, quit or retired. Competition for jobs remains tight. In Jun, there were 3 unemployed people for every job opening. In a healthy economy, that ratio is typically 2 to 1.
US job openings rise in June, but hiring falls Associated Press

Photo: Yahoo
CVS Caremark Q2 profit rose slightly more than expected, as profit growth at the pharmacy benefits management unit outpaced its drugstores. The company also narrowed its 2013 EPS forecast,, bringing the bottom of the range up by a penny & the top down by 4¢ cents, citing share repurchases largely coming in H2 & its results so far. New generic drugs weighed on sales but helped profits. Generic drugs sell for less than branded ones but are more profitable. EPS was 91¢, up from 75¢ a year earlier. Adjusted EPS from continuing operations rose to 97¢ from 81¢, topping the estimate of 96¢. Revenue was up 1.7% to $31.2B. Operating profit jumped 32% in the pharmacy benefits management business & 9% in the retail business. The company said it has repurchased $748M shares & has plans to buy back $4B in stock this year. CVS now expects adjusted EPS of $3.90-$3.96 this year, with EPS of $1-$1.03 in Q3. Analysts expect full-year EPS of $3.98, with 97¢ this quarter. The stock fell 1.86.
CVS Corp (CVS)
This is another quiet day in the markets, not a lot going on. The drop looks big but Dow is up more than 1K in more than a month. It needs time to rest. Getting little attention are the goings on in DC because everybody left town for a long summer break. When they get back next month, they will have to deal with funding the gov & raising the debt ceiling. The debt ceiling mess has not gone away, just postponed because the federal deficit has narowed to "only" 750B (what would have been a record a few years ago).


No comments:
Post a Comment