Dow slid 56, decliners just ahead of advancers & NAZ was off 5. The MLP index fell 3+ to 451 while the REIT index was about even at 279. Junk bond funds edged higher & Treasuries bounced back after yesterday's sell-off. Oil
dropped, paring a weekly gain, as US employers added fewer
workers than anticipated last month. Gold did little.
AMJ (Alerian MLP Index tracking fund)
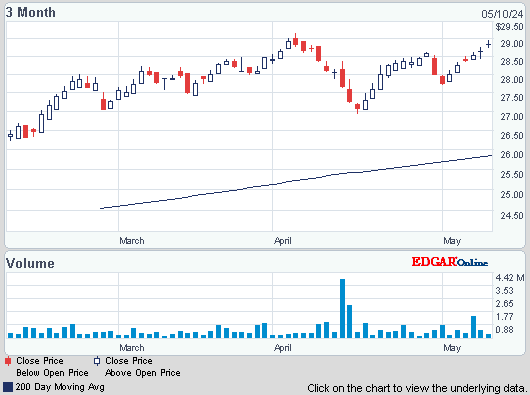

Photo: Yahoo
US employers slowed hiring in Jul but the jobless rate fell anyway, mixed signals that could make the Federal Reserve (FED) more cautious about drawing down its huge economic stimulus program. The number of jobs outside the farming sector increased by 162K, according to the Labor Dept. That was below the forecast 184K. Compounding that miss, the gov also cut its previous estimates for hiring in May & Jun. At the same time, the jobless rate fell 0.2% to 7.4%, its lowest since Dec 2008. Gains in employment fueled some of that decline, but the labor force also shrank during the month, robbing some of the luster from the decline in the unemployment rate. The data reinforces the view that the job market is inching toward recovery, with the broader economy still stuck in low gear. The growth in payrolls left the 3-month average gain at 175K.
Consumer spending in the US rose in line with forecasts in Jun as incomes grew, a sign the biggest part of the economy is withstanding fiscal headwinds. Household purchases, which account for 70% of the economy, rose 0.5%, after a 0.2% increase the prior month that was less than previously estimated, according to the Commerce Dept. The forecast called for a 0.5% rise. Incomes advanced 0.3%. Rising home values, stock price gains, & an improved job market are cushioning the effects of a payroll tax increase that began in Jan. Bit bigger spending gains are needed to overcome federal budget cuts & weak overseas economies, which are slowing growth. Adjusting consumer spending for inflation, purchases rose 0.1% in Jun, the same as in the previous month. The Commerce Dept price index tied to spending, a gauge tracked by the FED, increased 0.4%. The core price measure, which excludes food & fuel, rose 1.2% from the prior month.
Consumer Spending in U.S. Rose in Line With Forecast in June
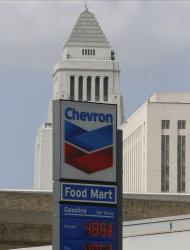
Photo: Yahoo
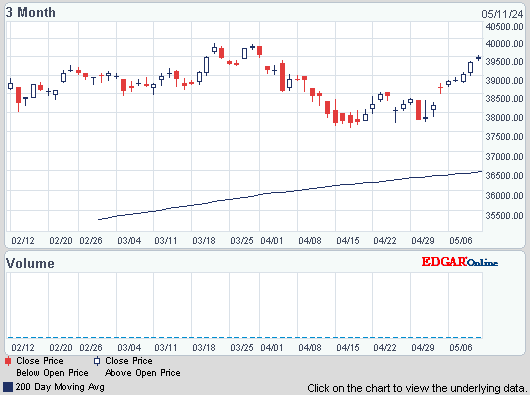
Stocks are taking it easy after roaring ahead yesterday. Dow still has an outstanding year with a gain of more than 2.4K. But much of that buying has come from the FED's low yield environment which will slow or end eventually. Now eventually means maybe weeks or a few months & the yield sectors have already felt selling pressure. Regular stocks may not be far behind.
Dow Jones Industrials
AMJ (Alerian MLP Index tracking fund)
Treasury yields:
U.S. 3-month |
0.04% | |
U.S. 2-year |
0.30% | |
U.S. 10-year |
2.62% |
| CLU13.NYM | ...Crude Oil Sep 13 | ...107.08 | (0.8%) |
| GCU13.CMX | ...Gold Sep 13 | .......1,309.40 | (0.1%) |

Photo: Yahoo
US employers slowed hiring in Jul but the jobless rate fell anyway, mixed signals that could make the Federal Reserve (FED) more cautious about drawing down its huge economic stimulus program. The number of jobs outside the farming sector increased by 162K, according to the Labor Dept. That was below the forecast 184K. Compounding that miss, the gov also cut its previous estimates for hiring in May & Jun. At the same time, the jobless rate fell 0.2% to 7.4%, its lowest since Dec 2008. Gains in employment fueled some of that decline, but the labor force also shrank during the month, robbing some of the luster from the decline in the unemployment rate. The data reinforces the view that the job market is inching toward recovery, with the broader economy still stuck in low gear. The growth in payrolls left the 3-month average gain at 175K.
Consumer spending in the US rose in line with forecasts in Jun as incomes grew, a sign the biggest part of the economy is withstanding fiscal headwinds. Household purchases, which account for 70% of the economy, rose 0.5%, after a 0.2% increase the prior month that was less than previously estimated, according to the Commerce Dept. The forecast called for a 0.5% rise. Incomes advanced 0.3%. Rising home values, stock price gains, & an improved job market are cushioning the effects of a payroll tax increase that began in Jan. Bit bigger spending gains are needed to overcome federal budget cuts & weak overseas economies, which are slowing growth. Adjusting consumer spending for inflation, purchases rose 0.1% in Jun, the same as in the previous month. The Commerce Dept price index tied to spending, a gauge tracked by the FED, increased 0.4%. The core price measure, which excludes food & fuel, rose 1.2% from the prior month.
Consumer Spending in U.S. Rose in Line With Forecast in June

Photo: Yahoo
Chevron's latest quarterly profit was huge at $5.4B, but down
26% from last year due to lower oil prices & maintenance work
at some refineries. The results lagged expectations. Chevron, a Dow stock, had EPS of $2.77 in Q2, down from $3.66 last year when net income was $7.2B. Analysts were expecting EPS of $2.97. Revenue fell 8% to $57.4B but came in higher than the $56B expected . CEO John Watson said earnings fell "largely due to
softer market conditions for crude oil and refined products." In addition,
repair & maintenance work on US refineries was also a factor. The average price for a barrel of oil or natural gas
liquids was $92 in the US & $94 overseas; both were down
$5 a barrel from last year's Q2. Natural gas prices in the
US jumped 74%, but that was up from 10-year lows in 2012. Production of oil & gas fell 1.6%. More natural gas was sold in the US, but sales of refined products such as gasoline dipped both at home & overseas. The stock slumped 2.49.
- Chevron's Profit Falls on Lower Oil Prices Associated Press
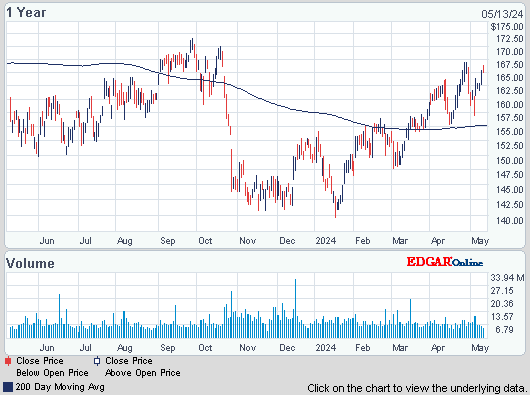
Chevron (CVX)
Stocks are taking it easy after roaring ahead yesterday. Dow still has an outstanding year with a gain of more than 2.4K. But much of that buying has come from the FED's low yield environment which will slow or end eventually. Now eventually means maybe weeks or a few months & the yield sectors have already felt selling pressure. Regular stocks may not be far behind.
Dow Jones Industrials




No comments:
Post a Comment