Dow shot up 162, advancers over decliners better 3-1 & NAZ gained 33. The Financial Index added 3 to 189. The MLP index was up a fraction to 364 & the REIT index rose 2+ to the 249s. Junk bond funds edged up while Treasuries pulled back. Oil & gold finally found buyers.


![Live 24 hours gold chart [Kitco Inc.]](http://www.kitco.com/images/live/gold.gif)

Photo: Bloomberg
The financial crisis wiped out 18 years of gains for the median US household net worth, with a 38.8% plunge from 2007 to 2010 that was led by the collapse in home prices, according to Federal Reserve (FED). Median net worth declined to $77K in 2010, the lowest since 1992, from $126K in 2007, the FED said in its Survey of Consumer Finances. Mean net worth fell 14.7% to a 9-year low of $499K from $585K. Almost every demographic group experienced losses, which may hurt retirement prospects for middle-income families, the report said. The declines in household wealth in the course of the longest & deepest recession in decades have held consumer spending that makes up about 70% of the economy. The FED has already taken unprecedented steps to boost the economy as it battled the 18-month recession that ended in Jun 2009, cutting its key interest rate to almost zero & purchasing $2.3T in debt to lower long-term borrowing costs. Even so, the jobless rate has stayed above 8% for more than 3 years, compared with the central bank’s long-range goal of 4.9-6%. “Although declines in the values of financial assets or business were important factors for some families, the decreases in median net worth appear to have been driven most strongly by a broad collapse in house prices,” the FED wrote. The S&P/Case-Shiller US Home Price Index fell 23% in the 3 years thru year end 2010 & the S&P 500 lost 14% in the same period. The proportion of families with retirement accounts decreased 2.6 points to 50.4% during the period, wiping out much of the 3.1 percentage-point increase over the prior 3 years. The recovery from the recession has been tough on a great many.
Financial Crisis Erased 18 Years of U.S. Household-Wealth Gains, Fed Says

Photo: Bloomberg
Zynga, the biggest maker of games played on Facebook (FB), fell to a record low after an analyst said usage declined last month as players switched to mobile devices. Shares sank under $5, the lowest since the IPO at $10 in Dec. The stock is down 41% YTD. Daily use for ZNGA social gaming dropped 8.2% in May & FB accounts for most of sale; taking a cut of virtual goods sold in ZNGA games. It is facing significantly more competition on smartphones & tablets. FB revenue may be negatively affected by users accessing the site on mobile devices rather than personal computers, since the company’s ability to make money off mobile users unproven. The stock fell 57¢ to $4.98, another new low & is $11 below the highs reached 3 months ago. Its problems are not a good sign for FB.
Zynga Tumbles to Record Low on Signs of Declining Use: San Francisco Mover
This was a mystery day. Nothing special drove the markets, but buyers came out & bid up stocks all day. Dow closed at its highs for the day. The Spanish debt situation remains iffy at best & Greek elections are around the corner. Nobody knows what they will bring. But Dow has recovered to where it was on May 18, erasing the deepest part of its fall. However it's still down more than 600 in Q2.


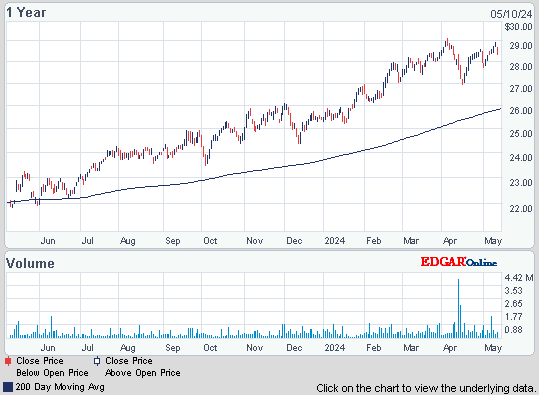
JPMorgan Chase Capital XVI (AMJ)
Click below for the latest market update:
Treasury yields:
U.S. 3-month | 0.086% | |
U.S. 2-year | 0.290% | |
U.S. 10-year | 1.657% |
| CLN12.NYM | Crude Oil Jul 12 | 83.37 |  0.67 (0.8%) 0.67 (0.8%) |
The financial crisis wiped out 18 years of gains for the median US household net worth, with a 38.8% plunge from 2007 to 2010 that was led by the collapse in home prices, according to Federal Reserve (FED). Median net worth declined to $77K in 2010, the lowest since 1992, from $126K in 2007, the FED said in its Survey of Consumer Finances. Mean net worth fell 14.7% to a 9-year low of $499K from $585K. Almost every demographic group experienced losses, which may hurt retirement prospects for middle-income families, the report said. The declines in household wealth in the course of the longest & deepest recession in decades have held consumer spending that makes up about 70% of the economy. The FED has already taken unprecedented steps to boost the economy as it battled the 18-month recession that ended in Jun 2009, cutting its key interest rate to almost zero & purchasing $2.3T in debt to lower long-term borrowing costs. Even so, the jobless rate has stayed above 8% for more than 3 years, compared with the central bank’s long-range goal of 4.9-6%. “Although declines in the values of financial assets or business were important factors for some families, the decreases in median net worth appear to have been driven most strongly by a broad collapse in house prices,” the FED wrote. The S&P/Case-Shiller US Home Price Index fell 23% in the 3 years thru year end 2010 & the S&P 500 lost 14% in the same period. The proportion of families with retirement accounts decreased 2.6 points to 50.4% during the period, wiping out much of the 3.1 percentage-point increase over the prior 3 years. The recovery from the recession has been tough on a great many.
Financial Crisis Erased 18 Years of U.S. Household-Wealth Gains, Fed Says
Zynga, the biggest maker of games played on Facebook (FB), fell to a record low after an analyst said usage declined last month as players switched to mobile devices. Shares sank under $5, the lowest since the IPO at $10 in Dec. The stock is down 41% YTD. Daily use for ZNGA social gaming dropped 8.2% in May & FB accounts for most of sale; taking a cut of virtual goods sold in ZNGA games. It is facing significantly more competition on smartphones & tablets. FB revenue may be negatively affected by users accessing the site on mobile devices rather than personal computers, since the company’s ability to make money off mobile users unproven. The stock fell 57¢ to $4.98, another new low & is $11 below the highs reached 3 months ago. Its problems are not a good sign for FB.
Zynga Tumbles to Record Low on Signs of Declining Use: San Francisco Mover
This was a mystery day. Nothing special drove the markets, but buyers came out & bid up stocks all day. Dow closed at its highs for the day. The Spanish debt situation remains iffy at best & Greek elections are around the corner. Nobody knows what they will bring. But Dow has recovered to where it was on May 18, erasing the deepest part of its fall. However it's still down more than 600 in Q2.
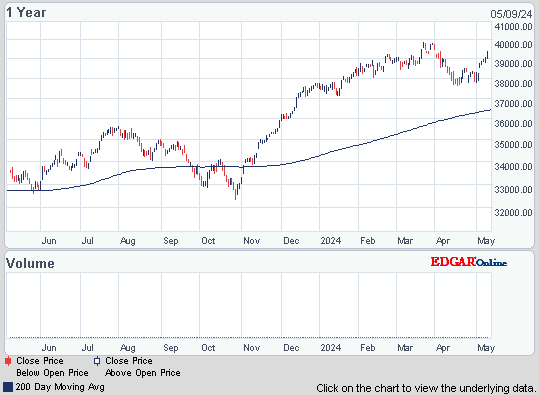
Dow Industrials
Get your favorite symbols' Trend Analysis TODAY!


 0.10
0.10