Stocks began the day higher, but selling has eliminated those gains. Dow is up 2, decliners over advancers 5-2 & NAZ is down 1. The Financial Index fell 1+ to the 205s after yesterday's big day. The MLP index was down another 1+ to 401 & the REIT index was off 1 to 250. Junk bond funds edged lower & Treasuries sold off badly, taking the yield on the 10 year Treasury to its highest in 4 months. Oil was flat but gold sank as risk averse investors responded to the rising stock markets by selling gold.


Photo: Bloomberg
The current account deficit for the US widened more than forecast in Q4 to $124B, the biggest in 3 years. The gap grew 15% from a revised $107B shortfall in Q3 that was smaller than initially estimated according to the Commerce Dept. Imports may keep rising as an improving job market underpins consumer spending & businesses replace outdated equipment. The balance of payments deficit is also a reminder of US dependence on foreign investors for funding. The gap for all of 2011 widened to $473B, or 3.1% of GDP, from $471B a year earlier. The gap represented 3.2% of GDP in Q4, compared with 2.8% in Q3. Rising oil costs are contributing to the shortfall. Crude oil averaged $94 last qtr, up from $89 in Q3. More recent figures indicate the current-account balance may widen in Q1. The trade gap grew to $52.6B in Jan, the biggest deficit since Oct 2008 (just after the Lehman collapse), from $50.4B in Dec. Imports rose to a record in Jan, as did exports of autos & capital goods. Imports are goods purchased in the US but not made here.
Current-Account Deficit in U.S. Widens to $124.1 Billion

Citigroup
Photo: Bloomberg
JPMorgan Chase Capital XVI (AMJ)
Treasury yields:
U.S. 3-month | 0.081% | |
U.S. 2-year | 0.374% | |
U.S. 10-year | 2.235% |
| CLJ12.NYM | .....Crude Oil Apr 12 | ...106.61 | .... | (0.1%) |
| GCH12.CMX | ...Gold Mar 12 | .......1,647.60 | ... | (2.7%) |
Get the latest daily market update below:

The current account deficit for the US widened more than forecast in Q4 to $124B, the biggest in 3 years. The gap grew 15% from a revised $107B shortfall in Q3 that was smaller than initially estimated according to the Commerce Dept. Imports may keep rising as an improving job market underpins consumer spending & businesses replace outdated equipment. The balance of payments deficit is also a reminder of US dependence on foreign investors for funding. The gap for all of 2011 widened to $473B, or 3.1% of GDP, from $471B a year earlier. The gap represented 3.2% of GDP in Q4, compared with 2.8% in Q3. Rising oil costs are contributing to the shortfall. Crude oil averaged $94 last qtr, up from $89 in Q3. More recent figures indicate the current-account balance may widen in Q1. The trade gap grew to $52.6B in Jan, the biggest deficit since Oct 2008 (just after the Lehman collapse), from $50.4B in Dec. Imports rose to a record in Jan, as did exports of autos & capital goods. Imports are goods purchased in the US but not made here.
Current-Account Deficit in U.S. Widens to $124.1 Billion

Photo: Bloomberg
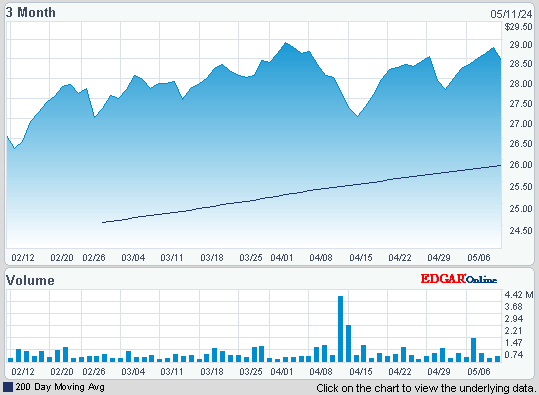
Citigroup, the lender that took the most gov aid, will try again to win approval for its capital plan after failing to meet minimum standards in US stress tests. The Federal Reserve (FED) objected to Citi’s plan, which may have included a request for a higher div, prompting the bank to say it will submit a revised version later this year. SunTrust (STI), Ally Financial & MetLife (MET) also fell short in the FEDs test. The results are a blow to Citi which is ready to return capital to shareholders. Capital plans submitted for the tests typically involve requests for higher divs & share buybacks. The tests may also set back Ally, the Detroit-based auto & home lender, which had planned an IPO to repay its bailout. The FED is testing to see how the capital of US banks might hold up thru a deep recession & a 2nd housing crisis. Ciit was off $1.07, STI was up 76¢ & MET fell $1.76.
Citigroup, SunTrust Banks Capital Plans Fail Fed Stress Tests

Photo: Yahoo
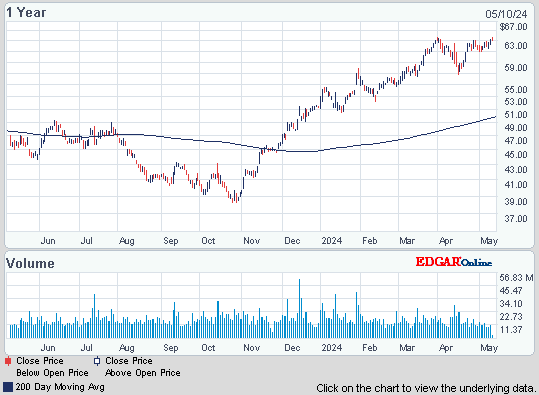
Zynga filed for a secondary stock offering of up to $400M, paving the way for some early investors to exit their holdings. Shares have risen 33% since the IPO. ZNGA is waiving the lock-up arrangement the company had with some of its existing stockholders to facilitate the offering (due to expire in May). After going public late last year some stockholders are cashing in on the stock rise. The stock fell 6¢ to $13.44.
Zynga Plans $400 Million Share Sale in Secondary Offering

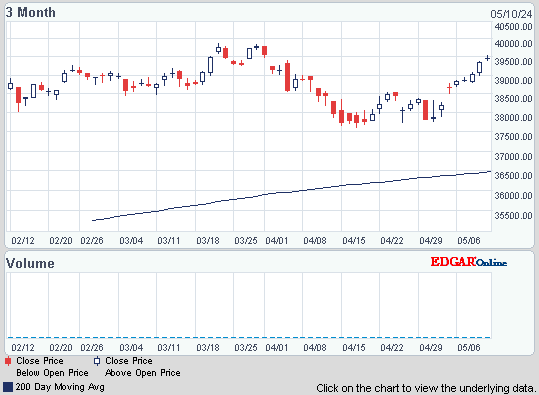
The markets need time to catch their breath. Dow is back to where it was 4 years ago, quite a run in the last 3 years. The rise in the last 2 days surprised me because of a lack of supporting stories. The US economy is doing well despite gas prices nearing their highs 4 years ago. MLPs have been market leaders during this rally but have slipped back in the last month. The spike up for the Dow puts it on a new plateau & the bulls are looking to take it higher.

Citigroup, SunTrust Banks Capital Plans Fail Fed Stress Tests
Citigroup Inc. (C)
Photo: Yahoo
Zynga filed for a secondary stock offering of up to $400M, paving the way for some early investors to exit their holdings. Shares have risen 33% since the IPO. ZNGA is waiving the lock-up arrangement the company had with some of its existing stockholders to facilitate the offering (due to expire in May). After going public late last year some stockholders are cashing in on the stock rise. The stock fell 6¢ to $13.44.
Zynga Plans $400 Million Share Sale in Secondary Offering
Zynga Inc. (ZNGA)
The markets need time to catch their breath. Dow is back to where it was 4 years ago, quite a run in the last 3 years. The rise in the last 2 days surprised me because of a lack of supporting stories. The US economy is doing well despite gas prices nearing their highs 4 years ago. MLPs have been market leaders during this rally but have slipped back in the last month. The spike up for the Dow puts it on a new plateau & the bulls are looking to take it higher.
Dow Industrials
Get your favorite symbols' Trend Analysis TODAY!


No comments:
Post a Comment