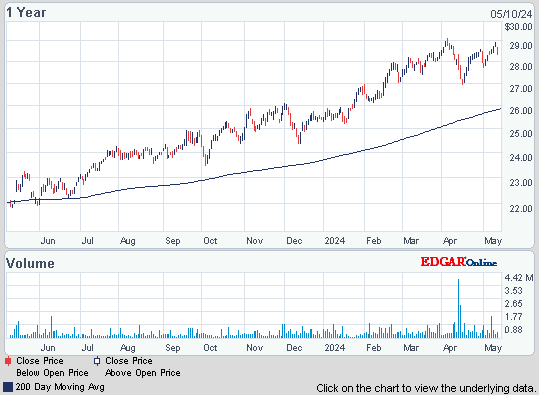
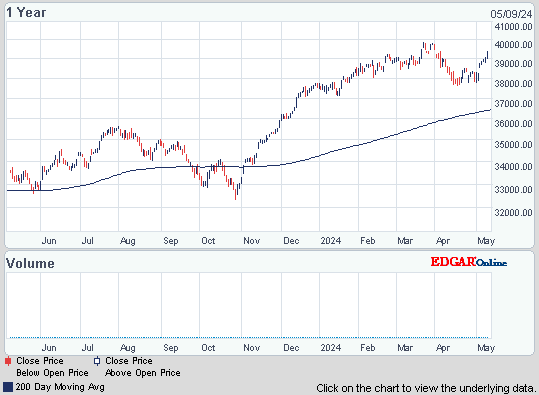
Dow rose 58 (closing at the highs), advancers over decliners a mild 4-3 & NAZ was up 15 (with no help from Apple). As has been the case recently, bank stocks led the way taking the Financial Index up almost 4 to the 211s.
The MLP index fell a fraction in the 396s (off its lows) & the REIT index was off pocket change in the 249s. Junk bond funds were mixed to lower while Treasuries had limited losses. Crude trimmed losses as the administration denied a report that the US & UK had agreed to release oil from strategic reserves. Gold, the green line in its graph, found buyers after its recent sell-off.

![Live 24 hours gold chart [Kitco Inc.]](http://www.kitco.com/images/live/gold.gif)


Photo: Bloomberg
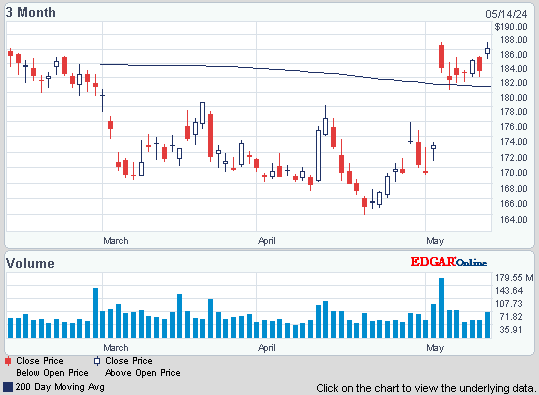
With a 45% move already in 2012, it's neither heresy nor bearish to suggest Apple shares may need a bit of a pause at some point. A baby dip may be upon us. Its shares, getting a boost from anticipation of the new iPad3, rose past $600 (another new record) today for the first time. However we may see a dip after iPad3 hits the shelves tomorrow, but it would come on the heels of the 6% gain the stock has had since the product was announced on Mar 7. Someday AAPL is going to slip up & the stock will suffer. From all appearances, its fans say that day of reckoning is well over the horizon. Profit taking finally reached the stock today, dropping 3 to 586.
Apple Passes $600 a Share for First Time Ahead of New IPad’s Sales Debut

Foreclosure filings fell 8% in February, the smallest year-over-year decrease since Oct 2010, as lenders began working through a backlog of seized properties, according to RealtyTrac. 207K homes received notices of default, auction or repossession last month, down 2% from Jan (one in every 637 households). Filings climbed in the 26 states where courts oversee foreclosures, rising 2% from Jan & 24% from a year earlier. Half of the 20 largest metropolitan areas had gains, led by Tampa & Miami. In the 24 states where seizures can proceed without court approval, filings declined 5% from Jan & 23% from Feb 2011. Default filings, a lender’s first notice of serious delinquency, were sent to 59K properties, up 1% from Jan & down 7% from a year earlier. Auctions were scheduled on 84K homes, down 2% from the previous month & 13% from a year earlier. Repossessions, the final stage of foreclosure, were completed on 64K properties, down 4% from Jan & 1% from Feb 2011. This dark cloud overhangs any housing recovery.
Foreclosure Filings Decline 8% in U.S. With Increase in Seizures to Come
Treasuries erased losses, pushing benchmark 10-year note yields down from the highest level in more than 4 months, as technical indicators suggested gov securities may have plunged too far, too fast. 10-year yields climbed for a 7th day, the longest stretch since 2006. The rate rose to as high as 2.35%, the most since Oct 28. While yields are rising, the 10-year rate is about 1.5 percentage points less than last year’s high of 3.77% reached on Feb 9. The yield has averaged 3.87% in the past decade.
The S&P 500 closed above 1400, a 4 year high, & chart people like to see that. Markets are feeling good after Dow broke thru the 13K barrier convincingly earlier this week. European debt issues have been put on a back burner, those problems will take care of themselves. One interesting diversion is with the MLPs which have been market leaders over the last 3 years. The fundamental business of MLPS, adding to pipelines & terminals for (mainly) oil & gas, has gone on thru the recession & the post recession period. So far, their recent lagging performance can be chalked up to as just one of those things & the increase in competitive Treasury yields.

The MLP index fell a fraction in the 396s (off its lows) & the REIT index was off pocket change in the 249s. Junk bond funds were mixed to lower while Treasuries had limited losses. Crude trimmed losses as the administration denied a report that the US & UK had agreed to release oil from strategic reserves. Gold, the green line in its graph, found buyers after its recent sell-off.
JPMorgan Chase Capital XVI (AMJ)
Click below for the latest market update:
Treasury yields:
U.S. 3-month | 0.076% | |
U.S. 2-year | 0.362% | |
U.S. 10-year | 2.276% |
| CLJ12.NYM | ...Crude Oil Apr 12 | ...105.35 | ... 0.08 0.08 | (0.1%) |
![Live 24 hours gold chart [Kitco Inc.]](http://www.kitco.com/images/live/gold.gif)


With a 45% move already in 2012, it's neither heresy nor bearish to suggest Apple shares may need a bit of a pause at some point. A baby dip may be upon us. Its shares, getting a boost from anticipation of the new iPad3, rose past $600 (another new record) today for the first time. However we may see a dip after iPad3 hits the shelves tomorrow, but it would come on the heels of the 6% gain the stock has had since the product was announced on Mar 7. Someday AAPL is going to slip up & the stock will suffer. From all appearances, its fans say that day of reckoning is well over the horizon. Profit taking finally reached the stock today, dropping 3 to 586.
Apple Passes $600 a Share for First Time Ahead of New IPad’s Sales Debut
Apple Inc. (AAPL)
Foreclosure filings fell 8% in February, the smallest year-over-year decrease since Oct 2010, as lenders began working through a backlog of seized properties, according to RealtyTrac. 207K homes received notices of default, auction or repossession last month, down 2% from Jan (one in every 637 households). Filings climbed in the 26 states where courts oversee foreclosures, rising 2% from Jan & 24% from a year earlier. Half of the 20 largest metropolitan areas had gains, led by Tampa & Miami. In the 24 states where seizures can proceed without court approval, filings declined 5% from Jan & 23% from Feb 2011. Default filings, a lender’s first notice of serious delinquency, were sent to 59K properties, up 1% from Jan & down 7% from a year earlier. Auctions were scheduled on 84K homes, down 2% from the previous month & 13% from a year earlier. Repossessions, the final stage of foreclosure, were completed on 64K properties, down 4% from Jan & 1% from Feb 2011. This dark cloud overhangs any housing recovery.
Foreclosure Filings Decline 8% in U.S. With Increase in Seizures to Come
Treasuries erased losses, pushing benchmark 10-year note yields down from the highest level in more than 4 months, as technical indicators suggested gov securities may have plunged too far, too fast. 10-year yields climbed for a 7th day, the longest stretch since 2006. The rate rose to as high as 2.35%, the most since Oct 28. While yields are rising, the 10-year rate is about 1.5 percentage points less than last year’s high of 3.77% reached on Feb 9. The yield has averaged 3.87% in the past decade.
The S&P 500 closed above 1400, a 4 year high, & chart people like to see that. Markets are feeling good after Dow broke thru the 13K barrier convincingly earlier this week. European debt issues have been put on a back burner, those problems will take care of themselves. One interesting diversion is with the MLPs which have been market leaders over the last 3 years. The fundamental business of MLPS, adding to pipelines & terminals for (mainly) oil & gas, has gone on thru the recession & the post recession period. So far, their recent lagging performance can be chalked up to as just one of those things & the increase in competitive Treasury yields.
Dow Industrials
Get your favorite symbols' Trend Analysis TODAY!


No comments:
Post a Comment