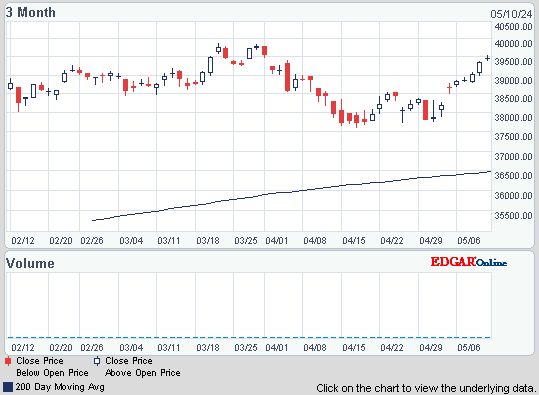
Dow is having a wishy-washy day. Now it's up 12, advancers slightly head of decliners & NAZ lost 6. The Financial Index was up a fraction in the 210s.
The MLP index was up a fraction in the 397s & the REIT index fell a fraction in the 248s. Junk bond funds were mixed but Treasuries extended their rally. Oil surged on a report that Iranian oil exports will drop 300K barrels a day because of tighter sanctions. Gold also saw buying.


Photo: Bloomberg
Sales of new homes fell in Feb for the 2nd straight month. The Commerce Dept said that new-home sales dropped 1.6% last month to an annual rate of 313K homes. Sales have fallen nearly 7% since Dec. While a mild winter & 3 months of strong job growth have lifted re-sales, those conditions haven't benefited the new-home market. The current pace is less than half the 700K considered to be healthy. However the gov revised Dec sales figures up to show an annual rate of 336K, the best sales pace in a year & the median sales price for new homes surged more than 8% to $233K . That's the highest median price since Jun & could suggest builders are anticipating more sales in the months to come. Each home built creates an average of 3 jobs for a year & generates about $90,000 in tax revenue. Builders are growing more confident after seeing a growing number of people express interest in buying this year. They've responded by requesting the most permits to build single-family homes & apartments since Oct 2008. Sales of previously occupied homes have risen more than 13% since Jul & Jan-Feb made up the best winter for re-sales in 5 years. A key reason for the dismal sales in the new-home market is that builders must compete with foreclosures & short sales (when lenders accept less for a house than what is owed on the mortgage). The housing recovery still has a number of problems.
Purchases of New Houses in U.S. Decrease for Second Month
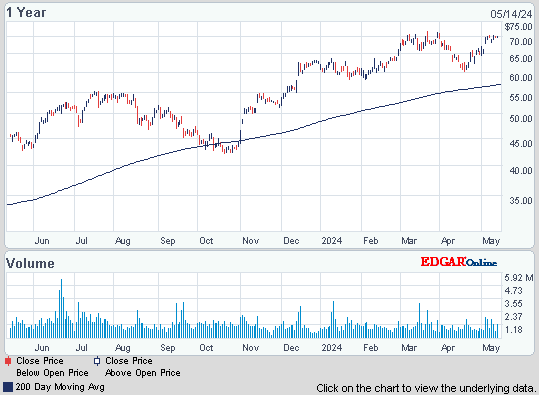
KB Home cut its Q1 loss by 60% as more homes were sold at higher prices. But results fell short of expectations. Orders fell 8% to 1197 as more customers canceled contracts. The cancellation rate rose to 36% from 29% in the months leading up to spring, traditionally the peak season for home sales. For qtr ended Feb 29, the loss per share was 59¢, better than $1.49 in the prior year. Revenue rose 29% to $254M from $197M, as the number of homes delivered increased 21% to 1150 & the average selling price rose 6% to $219K. Analysts expected a loss of 24¢ on $335M in revenue. Unfilled orders, representing future potential revenue, increased 30% to 2203. KBH said that while it appears job growth &consumer confidence may be improving & that the housing market may be starting to recover, it cautioned that the pace of the recovery has been uneven, with some regions recovering faster than others. The company said it hopes to return to profitability later this year. The stock fell $1.02 (9%).
KB Home Reports Narrower Loss on Higher Sales and Lower Charges

Gas at the pump went up to $3.89 yesterday.

Markets have lost the upward bias & are looking for direction. There is nothing significant happening so they are drifting with a downward bias. Dow lost 180 this week on a series of drab declines. For the bulls, 13K held so far. But I keep saying this is a tired market with little follow up news to encourage more buyers.

The MLP index was up a fraction in the 397s & the REIT index fell a fraction in the 248s. Junk bond funds were mixed but Treasuries extended their rally. Oil surged on a report that Iranian oil exports will drop 300K barrels a day because of tighter sanctions. Gold also saw buying.
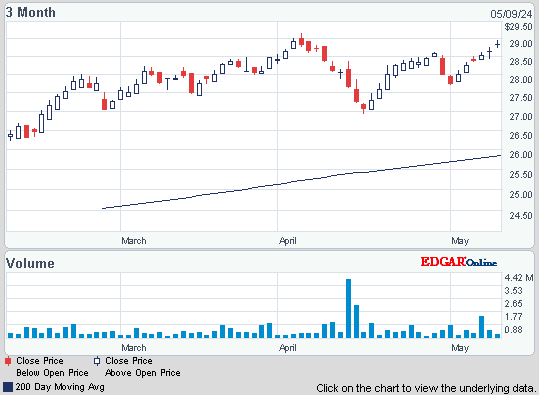
JPMorgan Chase Capital XVI (AMJ)
Treasury yields:
U.S. 3-month | 0.066% | |
U.S. 2-year | 0.348% | |
U.S. 10-year | 2.217% |
| CLK12.NYM | ...Crude Oil May 12 | ...106.87 | ...... | (1.4%) |
| GCH12.CMX | ...Gold Mar 12 | .........1,653.00 | ... | (0.7%) |
Get the latest market update below:

Photo: Bloomberg
Sales of new homes fell in Feb for the 2nd straight month. The Commerce Dept said that new-home sales dropped 1.6% last month to an annual rate of 313K homes. Sales have fallen nearly 7% since Dec. While a mild winter & 3 months of strong job growth have lifted re-sales, those conditions haven't benefited the new-home market. The current pace is less than half the 700K considered to be healthy. However the gov revised Dec sales figures up to show an annual rate of 336K, the best sales pace in a year & the median sales price for new homes surged more than 8% to $233K . That's the highest median price since Jun & could suggest builders are anticipating more sales in the months to come. Each home built creates an average of 3 jobs for a year & generates about $90,000 in tax revenue. Builders are growing more confident after seeing a growing number of people express interest in buying this year. They've responded by requesting the most permits to build single-family homes & apartments since Oct 2008. Sales of previously occupied homes have risen more than 13% since Jul & Jan-Feb made up the best winter for re-sales in 5 years. A key reason for the dismal sales in the new-home market is that builders must compete with foreclosures & short sales (when lenders accept less for a house than what is owed on the mortgage). The housing recovery still has a number of problems.
Purchases of New Houses in U.S. Decrease for Second Month
KB Home cut its Q1 loss by 60% as more homes were sold at higher prices. But results fell short of expectations. Orders fell 8% to 1197 as more customers canceled contracts. The cancellation rate rose to 36% from 29% in the months leading up to spring, traditionally the peak season for home sales. For qtr ended Feb 29, the loss per share was 59¢, better than $1.49 in the prior year. Revenue rose 29% to $254M from $197M, as the number of homes delivered increased 21% to 1150 & the average selling price rose 6% to $219K. Analysts expected a loss of 24¢ on $335M in revenue. Unfilled orders, representing future potential revenue, increased 30% to 2203. KBH said that while it appears job growth &consumer confidence may be improving & that the housing market may be starting to recover, it cautioned that the pace of the recovery has been uneven, with some regions recovering faster than others. The company said it hopes to return to profitability later this year. The stock fell $1.02 (9%).
KB Home Reports Narrower Loss on Higher Sales and Lower Charges
KB Home (KBH)
Gas at the pump went up to $3.89 yesterday.
| Regular | Mid | Premium | Diesel | 85 | **E85 MPG/BTU adjusted price | |
| Current Avg. | $3.889 | $4.030 | $4.160 | $4.156 | $3.293 | $4.334 |
| Yesterday Avg. | $3.881 | $4.021 | $4.151 | $4.153 | $3.287 | $4.326 |
| Week Ago Avg. | $3.831 | $3.973 | $4.104 | $4.126 | $3.265 | $4.297 |
| Month Ago Avg. | $3.579 | $3.712 | $3.846 | $3.959 | $3.135 | $4.126 |
| Year Ago Avg. | $3.551 | $3.690 | $3.822 | $3.940 | $3.021 | $3.975 |
Markets have lost the upward bias & are looking for direction. There is nothing significant happening so they are drifting with a downward bias. Dow lost 180 this week on a series of drab declines. For the bulls, 13K held so far. But I keep saying this is a tired market with little follow up news to encourage more buyers.
Dow Industrials
Get your favorite symbols' Trend Analysis TODAY!


No comments:
Post a Comment