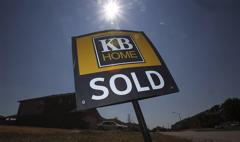
Showing posts with label KB home. Show all posts

Friday, March 23, 2012

Mixed markets on drab new home sales

Dow is having a wishy-washy day.  Now it's up 12, advancers slightly head of decliners & NAZ lost 6.  The Financial Index was up a fraction in the 210s.

The MLP index was up a fraction in the 397s & the REIT index fell a fraction in the 248s.  Junk bond funds were mixed but Treasuries extended their rally.  Oil surged on a report that Iranian oil exports will drop 300K barrels a day because of tighter sanctions.  Gold also saw buying.
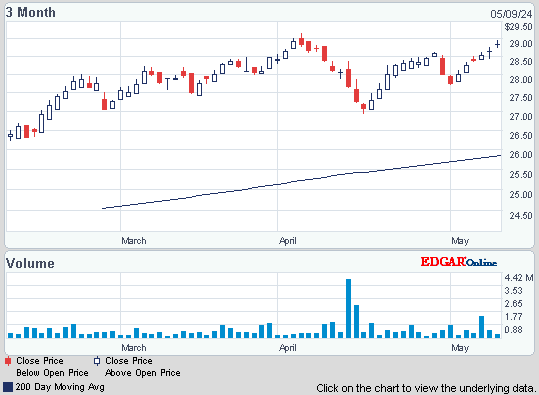
JPMorgan Chase Capital XVI (AMJ)


stock chart

Treasury yields:


U.S. 3-month

0.066%

U.S. 2-year

0.348%

U.S. 10-year

2.217%

CLK12.NYM...Crude Oil May 12...106.87 ......Up 1.52  (1.4%)

GCH12.CMX...Gold Mar 12.........1,653.00 ...Up 10.70  (0.7%)


Get the latest market update below:


U.S. New Home Sales Fall for Second Month

Photo:   Bloomberg

Sales of new homes fell in Feb for the 2nd straight month.  The Commerce Dept said that new-home sales dropped 1.6% last month to an annual rate of 313K homes.  Sales have fallen nearly 7% since Dec.  While a mild winter & 3 months of strong job growth have lifted re-sales, those conditions haven't benefited the new-home market.  The current pace is less than half the 700K considered to be healthy.  However the gov revised Dec sales figures up to show an annual rate of 336K, the best sales pace in a year & the median sales price for new homes surged more than 8% to $233K . That's the highest median price since Jun & could suggest builders are anticipating more sales in the months to come.  Each home built creates an average of 3 jobs for a year & generates about $90,000 in tax revenue.  Builders are growing more confident after seeing a growing number of people express interest in buying this year.  They've responded by requesting the most permits to build single-family homes & apartments since Oct 2008.  Sales of previously occupied homes have risen more than 13% since Jul & Jan-Feb made up the best winter for re-sales in 5 years.  A key reason for the dismal sales in the new-home market is that builders must compete with foreclosures & short sales (when lenders accept less for a house than what is owed on the mortgage).  The housing recovery still has a number of problems.

Purchases of New Houses in U.S. Decrease for Second Month


KB Home cut its Q1 loss by 60% as more homes were sold at higher prices.  But results fell short of expectations.  Orders fell 8% to 1197 as more customers canceled contracts.  The cancellation rate rose to 36% from 29% in the months leading up to spring, traditionally the peak season for home sales.   For qtr ended Feb 29,  the loss per share was 59¢, better than $1.49 in the prior year.  Revenue rose 29% to $254M from $197M, as the number of homes delivered increased 21% to 1150 & the average selling price rose 6% to $219K.   Analysts expected a loss of 24¢ on $335M in revenue.  Unfilled orders, representing future potential revenue, increased 30% to 2203.  KBH said that while it appears job growth &consumer confidence may be improving & that the housing market may be starting to recover, it cautioned that the pace of the recovery has been uneven, with some regions recovering faster than others.  The company said it hopes to return to profitability later this year.  The stock fell $1.02 (9%).

KB Home Reports Narrower Loss on Higher Sales and Lower Charges
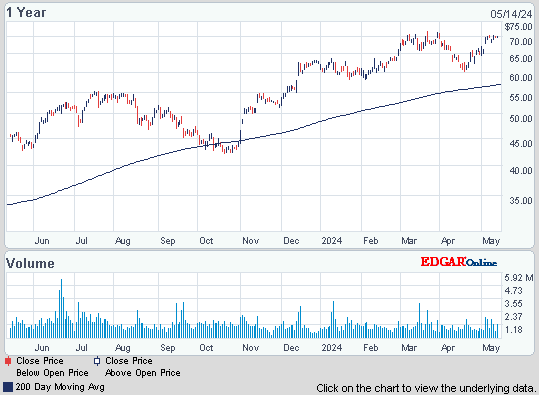
KB Home (KBH)


stock chart


Gas at the pump went up to $3.89 yesterday.

National Unleaded Average
Regular Mid Premium Diesel 85 **E85
MPG/BTU
adjusted
price
Current Avg. $3.889 $4.030 $4.160 $4.156 $3.293 $4.334
Yesterday Avg. $3.881 $4.021 $4.151 $4.153 $3.287 $4.326
Week Ago Avg. $3.831 $3.973 $4.104 $4.126 $3.265 $4.297
Month Ago Avg. $3.579 $3.712 $3.846 $3.959 $3.135 $4.126
Year Ago Avg. $3.551 $3.690 $3.822 $3.940 $3.021 $3.975


Markets have lost the upward bias & are looking for direction.  There is nothing significant happening so they are drifting with a downward bias.   Dow lost 180 this week on a series of drab declines.  For the bulls, 13K held so far.  But I keep saying this is a tired market with little follow up news to encourage more buyers.
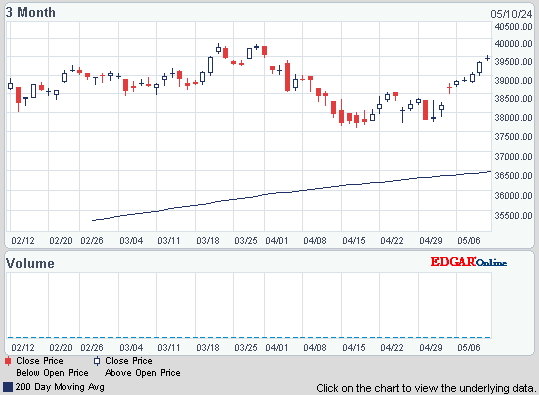
Dow Industrials


stock chart


Get your favorite symbols' Trend Analysis TODAY!  

Wednesday, December 21, 2011

Late day buying brings Dow into the black

Dow eked out a gain of 4, advancers over decliners better than 3-2 but NAZ pulled back 25 on weak tech earnings.  The Financial Index rose 1 to the 172s.

The MLP index rose 2+ to 280, just 10 below its record high reached 8 months ago, & the REIT index was flattish in the 228s.  Junk bond funds did little & Treasuries pulled back, taking their yields higher.  Oil held onto AM gains whie gold has been hanging in above $1600 in the last 2 days.

AMZ   Alerian MLP Index


DJR   Dow Jones Equity REIT Index


Click below the latest market update:


Treasury yields:


U.S. 3-month

0.005%

U.S. 2-year

0.271%

U.S. 10-year

1.962%


CLG12.NYM...Crude Oil Feb 12...98.77 ...Up 1.53  (1.6%)

Live 24 hours gold chart [Kitco Inc.]


Walgreen's, a Dividend Aristocrat, profits fell more than 4% due in part to a slow flu season & its split with the Express Scripts pharmacy network.  A 3-year contract between the companies ends next week.  WAG has received $5.3B in revenue from Express Scripts, but said it would rather give that up than continue filling unprofitable prescriptions.  Unless the companies strike a last-minute deal, most people whose prescription drug benefits are handled by Express Scripts won't be able to fill their prescriptions at WAG stores, starting next month.  WAG is the biggest drugstore chain in the US with 7800 locations.  EPS inched up to 63¢ from 62¢  last year when it had more shares outstanding.  Revenue grew 4.7% to $18.2B.  Analysts expected EPS of 67¢ on $18.24B in revenue.  Earlier this month, WAG said sales at stores open at least a year grew 2.5% during the qtr.  However the Express Scripts fight reduced those sales by 1.1%.  The stock lost 13¢.

Walgreen 1Q profit drops on Express Scripts fight AP

WAG    Walgreen Co.


  • <p>               In this Dec. 18, 2011 photo, a sold lot sits next to a structure being constructed in a KB Home community, in Balch Springs, Texas. KB Home’s fiscal fourth-quarter net income fell 20 percent on rising expenses, but its performance beat analysts’ expectations and revenue climbed on an increase in home deliveries and a higher average selling price.  (AP Photo/Tony Gutierrez)
Photo:    Yahoo

KB Home Q4 net income fell 20% on rising expenses, but revenue climbed on more home deliveries & a higher average selling price.  EPS was 18¢ in fiscal Q4 which compares with 23¢ last year & beat estimates of 4¢.  This was the company's first net profit in 2011.  Quarterly selling, general & administrative expenses climbed 36% to $75.6M.  Revenue rose 6% to $479.9M from $451M, topping estimates of $467.9M.  Home deliveries increased 4% & average selling price rose 3% to $238K (compared with $232K last year).  "We anticipate that our companywide average selling price will continue to grow in 2012 as we heighten our concentration in our most desirable markets, particularly in our West Coast region which typically generates higher profits,"  CEO Jeffrey Mezger said.  Q4 net orders rose 38% to 1494 from 1085.  Backlog also increased, to the highest year-end level since 2008, with a total of 2156 homes as of Nov 30 (far above a backlog of 1336 last year).  Cancellation rate as a percentage of gross orders was 34%, down from 37% last year.  For the full year, KBH had EPS of $2.32, compared with a loss of 90¢ in the previous year.  Annual revenue slipped 17% to $1.3B from $1.6B as the number of homes delivered fell 21%.  The stock dropped 52¢.  

KB Home Falls After Homebuilder Reports Smaller Profit, Weaker Margins

KBH   KB Home


  • A person uses the new Blackberry Bold 9900 at a release party to promote the BlackBerry OS 7 devices in Toronto August 3, 2011. REUTERS/Mark Blinch
Photo:   Yahoo

Research In Motion sales in the US fell for a 5th straight qtr in Q3 even as the BlackBerry maker's overall revenue jumped $1B from a year earlier.  Sales of RIM's BlackBerry smartphones & the PlayBook tablet in the US has struggled to keep up with Apple's (AAPL) iPhone & iPad as well as Android-based devices.  RIMM said it had US revenue of $1.03B in Q3, a 7% drop from the previous qtr.  It had US sales of $1.88B in the prior year.  The Canadian company, however, expanded elsewhere, with sales outside the US, Canada & Britain increasing 31% to $3.17B & made up 61% of total sales, up 5.4 percentage points from the year-before period.  Today the shares shot up more than 10% on buyout hopes, but those losses were pared after analysts said a buyout is unlikely as company executives focus on guiding their own turnaround.  The stock finished up $1.26 to $13.78 (10%).


RIMM   Research in Motion Ltd.


Tech stocks did not take disappointing earnings well, but the rest of the market held up OK.  News from Europe has quieted down, many are away on holiday.  The US congress is  in limbo with the fate of tax & unemployment extensions hanging on for dear life.  Dow held on, near the 12.2K interim high.  Maybe tomorrow it will decide what to do but I don't think so.

Dow Jones Industrial Average


Get your favorite symbols' Trend Analysis TODAY!  


Friday, September 23, 2011

Markets waver after largest weekly drop in 3 years

Dow rose 36, advancers ahead of decliner 3-2 & NAZ gained 24.  Bank stocks also recovered, but the chart for the Financial Index looks dreary as it's near the multi year lows.  The index bottomed at 85, 3 years ago.

S&P 500 Financials Sector Index


Value 157.13 One-Year Chart for S&P 500 Financials Sector Index GICS Level 1 (S5FINL:IND)
Change   1.45    (0.9%)

The MLP index fell 3 to just above 340 & the REIT was down 1 to 204. Junk bond funds were mixed as were Treasuries (at historic high levels with record low yields).  Oil fell below the important $80 level & gold is down about $230 from its recent record highs.  Commodities across the board have been weak, a bad sign, signalling that demand will decline from another recession.


ALERIAN MLP Index (^AMZ)


Treasury yields:


U.S. 3-month

-0.005%

U.S. 2-year

0.210%

U.S. 10-year

1.758%

CLX11.NYM....Crude Oil Nov 11...79.51 ....Down 1.00 (1.2%)

GCU11.CMX...Gold Sep 11......1,683.70 ...Down 55.50  (3.2%)


Get the latest market update below:


ECB ‘Ready’ to Ease Market Tensions

Photo:   Bloomberg

Europe's banks face a capital shortfall of hundreds of billions of €s if Greece forces them to slash the value of its debt by 50%, & other troubled euro zone countries like Italy & Ireland follow suit.  Pressure on Europe to shore up its banks is building, as talk of a possible Greek default gains pace. Banks could probably cope with a Greek default but markets would then focus on bigger countries & debt writedowns right across the region.  Banks could be forced to write down Greek debt holdings by half if Greece fails to get a deal for a 2nd bail-out. Worries about Europe's banks were left firmly in place after a statement from a French regulator said 15-20 banks needed more capital.  The same statement ruled out any French banks needing more capital however, & other major countries such as Germany & Spain are also dragging their heels, claiming their banks are in no desperate need.  Views on how much capital might be needed varies as confusion reigns.

ECB Ready to Act Next Month If Outlook Worsens


Photo:   Yahoo

KB Home fiscal Q3 loss widened, as it delivered fewer homes than a year ago when a federal homebuyer tax credit helped inflate deliveries & revenue.  Last year's tax credit contributed to a 40% climb in new home orders in this year's qtr.  Homebuilders have been reporting annual increases in new home orders this summer, but much of that is attributed to a hangover effect from the expiration of the tax credit.  New home sales plummeted last year after potential homebuyers no longer had the tax credit.  Even with the credit, new home sales in 2010 fell to the lowest level on records going back 47 years.  KBH reported an EPS loss of 13¢, in the qtr ended Aug 31, which compares with a loss of 2¢ a year earlier.  Revenue sank 27% to $367M from $501M last year.  Analysts were expecting a larger loss of 16¢ on $390M in revenue.  KBH delivered 1603 homes in Q3, compared to 2320 last year.  The decline in home deliveries was partially offset by a 6% increase in average selling price.  New orders climbed in each of its 4 geographic regions & jumped 73% in the West Coast.  The stock was up 20¢.

KB Home Reports Wider Third-Quarter Loss as House Sales Drop

KB Home (KBH)


stock chart


Markets are taking a breather after a terrible week.  Even with today's modest gain, Dow is down more than 700.  The European debt mess drags on as the officials are trying to plug holes before they become even bigger.  The US economy continues to struggle as shown by the KBH results.  Banks aren't lending as they should because of many fears.  Companies are not putting much off their excess cash to work, again because of fears.  With no major new developments, the rest of the day could see relief buying.  But next week should be another tough time for stocks.

Dow Industrials (INDU)


stock chart


Find out what's inside Trend TV  


Get your favorite symbols' Trend Analysis TODAY!  

Tuesday, April 5, 2011

Markets vacillate on weaker service industry growth

Dow inched up 1, advancers barely ahead of decliners  & NAZ gained 8.  Bank stocks were also little changed. 

S&P 500 FINANCIALS INDEX

Value 221.88 One-Year Chart for S&P 500 FINANCIALS INDEX (S5FINL:IND)
Change    -0.44   (-0.2%)


The MLP index fell 1 to 381, stlll looking to take out the old record high, while the REIT index was flat in the 237s.  Junk bond funds were mixed as were Treasuries.  The yield on the 10 year Treasury bond has remained close to 3.4% for over 3 months.  Oil prices held near 2-1/2 year highs as unrest in oil exporting countries in the MidEast & Africa outweighed China's 4th interest rate hike in 6 months.  Gold is still kicking around the 1430s, just under setting new records.

JPMorgan Chase Capital XVI (AMJ)


stock chart

Treasury yields:


U.S. 3-month
0.06%
U.S. 2-year
0.78%
U.S. 10-year
3.43%

CLK11.NYM...Crude Oil May 11...108.03 ...Down 0.44  (0.4%)

GCJ11.CMX....Gold Apr 11.........1,433.70 ...Up 1.50  (0.1%)


The service sector in the US expanded in Mar for the 16th straight month, although growth slowed from the previous month's pace (the fastest in more than 5 years).  The Institute for Supply Management index of service-sector activity dropped to 57.3 last month, from 59.7 in Feb, the first drop in 7 months. Still, any reading above 50 indicates expansion.  Estimates ranged from 57.7-61.  By way of comparison, the index plummeted to 37.6 in Nov 2008 at the height of the financial crisis.  The measure of new orders decreased to 64.1 from 64.4 in Feb, while the gauge of business activity fell to 59.7 from 66.9 & the employment gauge dropped to 53.7 from 55.6 a month earlier. The index of prices paid declined to 72.1 from 73.3.  Respondents expressed concern about rising fuel prices.

U.S. Service Industries Grew Less Than Forecast in March


Texas Instruments Bets Sales Army Can Spur National’s Growth

Photo:   Bloomberg

Texas Instruments (TXN) is buying National Semiconductor (NSM) for $6.5B, paying a 78% premium to merge 2 of the industry's oldest firms into a dominant force in analog microchips used in products ranging from phones to cars. TXN will pay $25 for each NSM share, lifting NSM $10 to over $24.. The acquisition would extend TXN lead in the vast, fragmented market for analog chips.  The extravagant premium could be to seal a deal & thwart rival bidders. TXN said it was "comfortable" with the price & estimates $100 million in annual cost savings.  TXN rose 56¢.

Texas Instruments Bets It Can Stoke National Semi’s Growth

Texas Instruments Incorporated (TXN)


stock chart


KB Home (KBH) widened its per share loss for the qtr ended Feb 28 to $1.49 from 71¢ a year earlier. Analysts predicted a loss of 30¢.  KBH has communities in some of the markets hardest-hit by foreclosures, including Las Vegas, Riverside County California & Phoenix.  The loss of $114.5M included an impairment charge of $53.7M & a loss on a loan guaranty of $22.8M.  Revenue declined 25% from a year earlier to $196.9M & net orders slid 32% to 1302. The company delivered 949 homes in the qtr, down 28% from the same period in 2010. The stock dropped 76¢ in what has been a dreary year. 

KB Home Reports Wider First-Quarter Loss as Revenue and Orders Plunged

KB Home (KBH)


stock chart


A major buyout should have brought more buyers into the markets, but it didn't.  The economic data was mushy, but not terrible.  Problems around the globe are weighing on the markets & approaching earnings season is being viewed with caution. 

Dow Industrials (INDU)


stock chart


Find out what's inside Trend TV!!  


Get your favorite symbols' Trend Analysis TODAY!