Dow rose 23 (56 below its high), advancers ahead of decliners 3-1 & NAZ was up 10. The Financial Index gained 2+ to finally go over 200 after failing for the last month.
The MLP index was flat at 408 & the REIT index rose a fraction to 244. Junk bond funds were mixed to higher (at multi year highs) but Treasuries sold off on the jobless claims data. Oil climbed for a 2nd day as the US increased pressure on Iran to halt its nuclear program & improving American economic data bolstered optimism that demand will grow. Gold rebounded after the previous day's 5% price plunge, its biggest one-day drop since Oct 2008, after Ben Bernanke gave no hints of a QE3.

Photo: Yahoo
The number of unemployment benefits fell slightly last week to the lowest point in 4 years. 351K sought unemployment aid, down from 353K in the prior week according to the Labor Dept, matching the 4-year low reached 3 weeks ago. The data shows that fewer people are being laid off & suggests that some companies are stepping up hiring. The 4-week average fell to 354K, also the lowest in 4 years. Applications for unemployment have fallen steadily since the early fall & are now down nearly 15% since Oct. When applications drop consistently below 375K, it usually signals that hiring is strong enough to lower the unemployment rate. Another strong month of hiring is expected for Feb (data will be released on Mar 9), similar to the average net gain of about 200K jobs in each of the previous 3 months.
Initial Jobless Claims Lowest Since March ’08

Photo: Bloomberg
In Feb, US manufacturing unexpectedly expanded at a slower pace than forecast as orders cooled. The Institute for Supply Management factory index dropped to 52.4 from 54.1 in Jan (readings above 50 signal growth). The median forecast was 54.5. The figure is at odds with regional manufacturing data for the month, showing the factory expansion accelerated. Gains in auto sales & increased exports are contributing to growth in the industry while higher fuel costs & less inventory expansion may be limiting orders. The ISM production index was little changed at 55.3 from 55.7. The new orders measure eased to 54.9 from 57.6, while the gauge of export orders climbed to 59.5 from 55. The employment gauge dropped to 53.2 from 54.3 in the prior month. The index of prices paid increased to 61.5 from 55.5 in the prior month. The measure of orders waiting to be filled was little changed at 52 after 52.5. The inventory index held at 49.5, while a gauge of customer stockpiles dropped to 46 from 47.5. High priced gas may be working its way thru & pinching the economy.
Manufacturing in U.S. Unexpectedly Expands at a Slower Pace as Orders Cool
Photo: Yahoo
Wal-Mart, a Dow stock & Dividend Aristocrat, raised its annual dividend 9% to $1.59, up from $1.46 last year. Last year, WMT raised the div 20%. In addition WMT, a big buyer of its shares, announced a $15B share repurchase plan in Jun. It has high expectations for the current fiscal year, with the core Walmart US business "back on track," Chief Executive Mike Duke said. Walmart US posted its 2nd straight rise in quarterly same-store sales last week, & traffic in the stores rose for the first time after 6 quarterly declines. The stock was up all of 9¢.
Wal-Mart Raises Dividend Nearly 9%

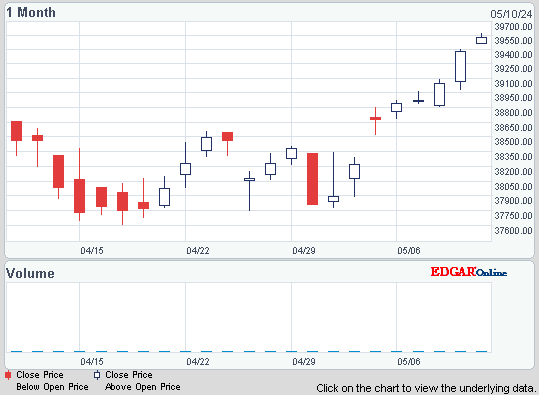
The jobless data looks good but the manufacturing report was soggy. The overall effect on the markets should have been positive, but their response has been wishy washy. Initial enthusiasm did not last. The Dow chart is shown for Feb & gives a better picture of its sideways performance in the last 2 weeks as gas prices were marching higher & refinancing the Greek debt mess became fuzzy. Gold is up a very big $200 in 2012 (bets against more market advances). If the gold bugs are right, the markets may not be able to extend their 5 month rally.

The MLP index was flat at 408 & the REIT index rose a fraction to 244. Junk bond funds were mixed to higher (at multi year highs) but Treasuries sold off on the jobless claims data. Oil climbed for a 2nd day as the US increased pressure on Iran to halt its nuclear program & improving American economic data bolstered optimism that demand will grow. Gold rebounded after the previous day's 5% price plunge, its biggest one-day drop since Oct 2008, after Ben Bernanke gave no hints of a QE3.
JPMorgan Chase Capital XVI (AMJ)
Treasury yields:
U.S. 3-month | 0.071% | |
U.S. 2-year | 0.297% | |
U.S. 10-year | 2.028% |
| CLJ12.NYM | Crude Oil Apr 12 | 107.58 |
| GCH12.CMX | Gold Mar 12 | 1,706.90 |
Get the latest daily market update below:
Photo: Yahoo
The number of unemployment benefits fell slightly last week to the lowest point in 4 years. 351K sought unemployment aid, down from 353K in the prior week according to the Labor Dept, matching the 4-year low reached 3 weeks ago. The data shows that fewer people are being laid off & suggests that some companies are stepping up hiring. The 4-week average fell to 354K, also the lowest in 4 years. Applications for unemployment have fallen steadily since the early fall & are now down nearly 15% since Oct. When applications drop consistently below 375K, it usually signals that hiring is strong enough to lower the unemployment rate. Another strong month of hiring is expected for Feb (data will be released on Mar 9), similar to the average net gain of about 200K jobs in each of the previous 3 months.
Initial Jobless Claims Lowest Since March ’08

Photo: Bloomberg
In Feb, US manufacturing unexpectedly expanded at a slower pace than forecast as orders cooled. The Institute for Supply Management factory index dropped to 52.4 from 54.1 in Jan (readings above 50 signal growth). The median forecast was 54.5. The figure is at odds with regional manufacturing data for the month, showing the factory expansion accelerated. Gains in auto sales & increased exports are contributing to growth in the industry while higher fuel costs & less inventory expansion may be limiting orders. The ISM production index was little changed at 55.3 from 55.7. The new orders measure eased to 54.9 from 57.6, while the gauge of export orders climbed to 59.5 from 55. The employment gauge dropped to 53.2 from 54.3 in the prior month. The index of prices paid increased to 61.5 from 55.5 in the prior month. The measure of orders waiting to be filled was little changed at 52 after 52.5. The inventory index held at 49.5, while a gauge of customer stockpiles dropped to 46 from 47.5. High priced gas may be working its way thru & pinching the economy.
Manufacturing in U.S. Unexpectedly Expands at a Slower Pace as Orders Cool
Photo: Yahoo
Wal-Mart, a Dow stock & Dividend Aristocrat, raised its annual dividend 9% to $1.59, up from $1.46 last year. Last year, WMT raised the div 20%. In addition WMT, a big buyer of its shares, announced a $15B share repurchase plan in Jun. It has high expectations for the current fiscal year, with the core Walmart US business "back on track," Chief Executive Mike Duke said. Walmart US posted its 2nd straight rise in quarterly same-store sales last week, & traffic in the stores rose for the first time after 6 quarterly declines. The stock was up all of 9¢.
Wal-Mart Raises Dividend Nearly 9%
Wal-Mart Stores, Inc. (WMT)
The jobless data looks good but the manufacturing report was soggy. The overall effect on the markets should have been positive, but their response has been wishy washy. Initial enthusiasm did not last. The Dow chart is shown for Feb & gives a better picture of its sideways performance in the last 2 weeks as gas prices were marching higher & refinancing the Greek debt mess became fuzzy. Gold is up a very big $200 in 2012 (bets against more market advances). If the gold bugs are right, the markets may not be able to extend their 5 month rally.
Dow Industrials
Get your favorite symbols' Trend Analysis TODAY!


No comments:
Post a Comment