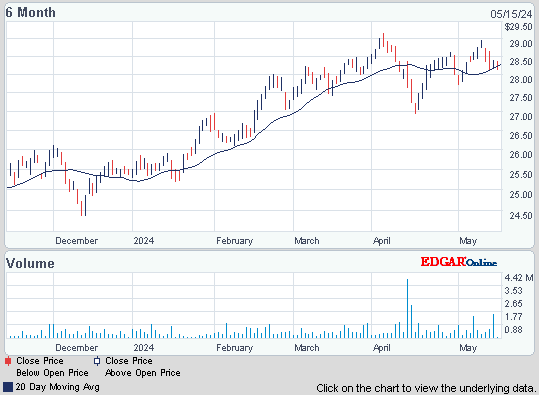
Dow hovered near breakeven all day with selling into the close. It finished down 43, decliners ahead of advancers 4-3 & NAZ slid 2. The Financial Index dropped 2 to the 213s, profit taking with the index still up 38 in Q1. The MLP index fell 1½ to the 395s & the REIT index was up a fraction in the 253s to its yearly highs. The chart below shows the run for an ETF that tracks the Alerian MLP index & it's pretty, although it's had tough going in the last month. Junk bond funds were mixed but Treasuries rallied after their recent sell-off. Oil did little after rumors about the US releasing oil from its strategic reserves. The immediate effect could lower prices, but the downward pressure on prices should not last. Gold pulled back slightly after yesterday's rally.

![Live 24 hours gold chart [Kitco Inc.]](http://www.kitco.com/images/live/gold.gif)


Photo: Bloomberg
Enbridge Inc (ENB) & Enterprise Products Partners (EPD) will more than double the capacity of the Seaway Pipeline, easing a major oil glut in the US that has led to an unprecedented distortion in crude markets. The expansion would add 450K barrels per day (bpd) of capacity to the Seaway system, raising its capacity to 850K bpd by mid-2014. The company also plans to increase the size of its Flanagan South Pipeline from Flanagan, Illinois to Cushing, Oklahoma, to a 36-inch diameter line with an initial capacity of 585K bpd. The estimated cost would increase to $2.8B from $1.9B. ENB share of the cost of the Seaway pipeline twin line & extension is expected to be about $1B. The companies are racing to unlock a glut of crude in the Midwest, which has built up over the year due to rising supplies from Canada & North Dakota. Ballooning inventories at Cushing, the storage hub for US crude has led to a greater price difference between US crude & the European benchmark Brent. The US crude discount to Brent hit a record $28 in Oct, but the spread is now around $18. "Enbridge's Gulf Coast Access projects give Bakken and western Canadian producers timely, economical and reliable options to deliver a variety of crudes to refinery hubs throughout the heart of North America and now as far as the Gulf Coast," said Patrick D. Daniel, CEO of ENB said. It's MLP subsidiary, Enbridge Energy (EEP), will build & operate the extension of its pipeline which comes down from Canada. EEP units slipped 4¢.
Enbridge Venture Plans Pipes to Gulf as Keystone Blocked

Photo: Yahoo
Lennar posted a sharp jump in new orders & said it was seeing real signs of recovery in the housing market. "The housing market and the overall economy 0are stabilizing and a very real trend is beginning to take shape," CEO Miller said. Q1 new orders jumped 33% to 3022 homes. LEN has been able to increase prices & reduce sales incentives in some of its communities. Orders have been increasing for 4 straight qtrs as low interest rates & home prices have helped improve sentiments towards owning a home. Homebuilder sentiment in Mar was the highest level since Jun 2007. Permits for homebuilding neared a 3½ year high in Feb reinforcing views that home building would add to economic growth this year for the first time since 2005. However, CEO Miller warned that the recovery process would not be smooth. "The stabilization process after a full seven year decline in housing is rocky and erratic and is certainly not yet broad-based," Miller said. He said recovery will emanate from the most desirable markets & spread slowly outward over the next few years. The stock rose 1.22 (5%).
Lennar Hits Highest Since 2007 as Income Beats Estimates

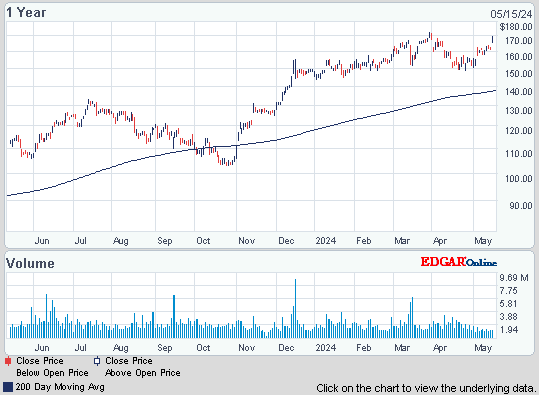
Walgreen, a Dividend Aristocrat, posted a 7.6% decline in quarterly profit as it filled fewer prescriptions due to the loss of a contract & a mild flu season. WAG stopped filling prescriptions for patients in the Express Scripts (ESRX) after the companies failed to agree on a new contract. The number of prescriptions filled at comparable WAG stores fell 8.6% in Jan & 9.5% during the first 28 days of Feb. EPS was 78¢ in fiscal Q2 versus 80¢ a year earlier. Sales rose 0.8% to $18.6B & sales at stores open at least a year, or same-store sales, fell 1.5%. The stock rose 41¢, but has a drab chart over the last year.
Walgreen Profit Tops Analysts’ Estimates as New Food Products Boost Sales

Dow is having another excellent month & qtr. It's up 245 in Mar & almost 1K in Q1. The major driver has been improved economic data in the US with stronger factory output & more hiring of workers leading to a lower unemployment rate. But earnings season begins in 2 weeks & there is a lot of nervousness which has been holding back buyers in recent weeks. Also, gas at the pump is pushing $3.90 which compares with an all time record of $4.11. High priced gas has always been a major negative for the stock market.
JPMorgan Chase Capital XVI (AMJ)
Click below for the latest market update:
Treasury yields:
U.S. 3-month | 0.081% | |
U.S. 2-year | 0.323% | |
U.S. 10-year | 2.187% |
| CLK12.NYM | ...Crude Oil May 12 | ...107.24 | ... 0.21 0.21 | (0.2%) |
![Live 24 hours gold chart [Kitco Inc.]](http://www.kitco.com/images/live/gold.gif)


Enbridge Inc (ENB) & Enterprise Products Partners (EPD) will more than double the capacity of the Seaway Pipeline, easing a major oil glut in the US that has led to an unprecedented distortion in crude markets. The expansion would add 450K barrels per day (bpd) of capacity to the Seaway system, raising its capacity to 850K bpd by mid-2014. The company also plans to increase the size of its Flanagan South Pipeline from Flanagan, Illinois to Cushing, Oklahoma, to a 36-inch diameter line with an initial capacity of 585K bpd. The estimated cost would increase to $2.8B from $1.9B. ENB share of the cost of the Seaway pipeline twin line & extension is expected to be about $1B. The companies are racing to unlock a glut of crude in the Midwest, which has built up over the year due to rising supplies from Canada & North Dakota. Ballooning inventories at Cushing, the storage hub for US crude has led to a greater price difference between US crude & the European benchmark Brent. The US crude discount to Brent hit a record $28 in Oct, but the spread is now around $18. "Enbridge's Gulf Coast Access projects give Bakken and western Canadian producers timely, economical and reliable options to deliver a variety of crudes to refinery hubs throughout the heart of North America and now as far as the Gulf Coast," said Patrick D. Daniel, CEO of ENB said. It's MLP subsidiary, Enbridge Energy (EEP), will build & operate the extension of its pipeline which comes down from Canada. EEP units slipped 4¢.
Enbridge Venture Plans Pipes to Gulf as Keystone Blocked
Enbridge Energy, L.P. (EEP)
Photo: Yahoo
Lennar posted a sharp jump in new orders & said it was seeing real signs of recovery in the housing market. "The housing market and the overall economy 0are stabilizing and a very real trend is beginning to take shape," CEO Miller said. Q1 new orders jumped 33% to 3022 homes. LEN has been able to increase prices & reduce sales incentives in some of its communities. Orders have been increasing for 4 straight qtrs as low interest rates & home prices have helped improve sentiments towards owning a home. Homebuilder sentiment in Mar was the highest level since Jun 2007. Permits for homebuilding neared a 3½ year high in Feb reinforcing views that home building would add to economic growth this year for the first time since 2005. However, CEO Miller warned that the recovery process would not be smooth. "The stabilization process after a full seven year decline in housing is rocky and erratic and is certainly not yet broad-based," Miller said. He said recovery will emanate from the most desirable markets & spread slowly outward over the next few years. The stock rose 1.22 (5%).
Lennar Hits Highest Since 2007 as Income Beats Estimates
Lennar Corporation (LEN)
Walgreen, a Dividend Aristocrat, posted a 7.6% decline in quarterly profit as it filled fewer prescriptions due to the loss of a contract & a mild flu season. WAG stopped filling prescriptions for patients in the Express Scripts (ESRX) after the companies failed to agree on a new contract. The number of prescriptions filled at comparable WAG stores fell 8.6% in Jan & 9.5% during the first 28 days of Feb. EPS was 78¢ in fiscal Q2 versus 80¢ a year earlier. Sales rose 0.8% to $18.6B & sales at stores open at least a year, or same-store sales, fell 1.5%. The stock rose 41¢, but has a drab chart over the last year.
Walgreen Profit Tops Analysts’ Estimates as New Food Products Boost Sales
Walgreen Co. (WAG)
Dow is having another excellent month & qtr. It's up 245 in Mar & almost 1K in Q1. The major driver has been improved economic data in the US with stronger factory output & more hiring of workers leading to a lower unemployment rate. But earnings season begins in 2 weeks & there is a lot of nervousness which has been holding back buyers in recent weeks. Also, gas at the pump is pushing $3.90 which compares with an all time record of $4.11. High priced gas has always been a major negative for the stock market.
Get your favorite symbols' Trend Analysis TODAY!


No comments:
Post a Comment