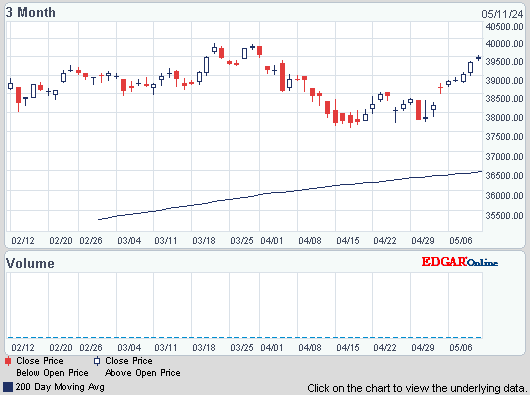
Dow eased back 43, decliners over advancers 3-2 & NAZ was off 14. The Financial Index lost 1 to the 196s. The MLP index was up a fraction to 396, another 10 week high, & the REIT index slipped a fraction in the 267s (its' yearly high). Junk bond funds edged lower & Treasuries also pulled back. Oil & gold moved little today.

Intl demand for US financial assets rose in May as investors sought shelter from the European debt mess. Net buying of long-term equities, notes & bonds totaled $55B during the month (a bad month for the stock market), compared with net purchases of $27B in Apr according to the Treasury Dept. Projections were for net buying of $41B. Including short-term securities such as stock swaps, foreigners bought a net $101B in May, compared with net selling of $8.2B in Apr. US assets have maintained their attraction as EU leaders grapple with a financial crisis that has pushed up Italian borrowing costs while the euro area bails out Spanish banks. China's growth slowed for a 6th qtr to the weakest pace since the global financial crisis, while the IMF said the world economy will increase 3.9% next year, down from 4.1% projected in Apr. Foreign buying of securities has likely continued strong, helping markets rebound in the last month.
International Demand for U.S. Assets Rises on Europe Crisis

Photo: Bloomberg
US industrial production rose in Jun as factories made more cars, machines & business equipment. Factory output recovered to levels reached earlier this spring but appears to be leveling off. The Federal Reserve (FED) says factory output rose 0.7% last month, after falling by the same amount in May. Factories produced more machines & vehicles used by businesses. Auto production rebounded after its first decline of the year. Factories are a crucial contributor to economic expansion & their strong results in Jun follow a period of shaky growth when factory output fell in 2 of the past 4 months. The FED says factory growth in Q2 slowed to an annual rate of 1.4%, after leaping 9.8% in Q1. Hiring by manufacturers also slowed in recent months. Better news but the economic recovery remains iffy.
Industrial Production in U.S. Rises in Sign of Resilienc

Photo: Bloomberg
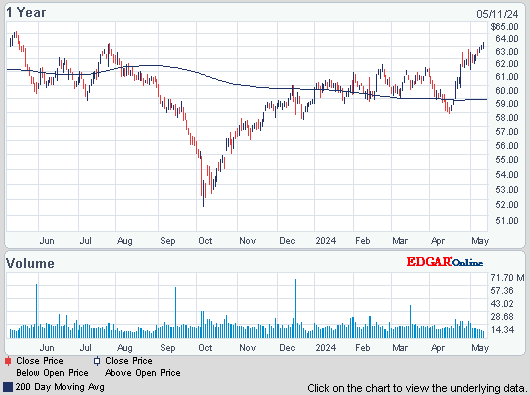
The Coca-Cola, a Dow stock & Dividend Aristocrat, net income slipped in Q2, as rising costs for ingredients offset its expansion overseas. Revenue growth was powered by emerging markets such as India, where volume rose 20%, but was offset by higher costs for ingredients, rising 5% from a year ago, & weakness in Europe where several regions there suffered from economic uncertainty & poor weather. Its sales volume fell 4%. In the US, sales volume rose 1%, while a mix of higher prices & a variety of smaller bottles & cans helped lift revenue 5%. However, volume for its flagship sparkling beverages (Coke & Sprite) fell 2%. As soda consumption in the US continues to decline, KO has increasingly been looking past its namesake drink for growth. The company said volume of its still beverages, such as Powerade & Smartwater, rose 8% in Q2. Its juice brands rose 3%, driven by growth in lower-calorie Minute Maid offerings. Given the saturated US market, KO is also increasingly pinning its fortunes on intl markets where the ranks of middle-class consumers are multiplying at a rapid clip by establishing an early dominance in foreign markets that could help determine its growth trajectory in the years to come. Last month, for example, the company said it would accelerate its investment in India to $5B over the next 8 years, more than double the $2B it invested since re-entering the country in 1993. In Q2, EPS was $1.21, slightly below $1.20 last year (when there were more outstanding shares). Not including one-time items, EPS was $1.22. Revenue rose 3% to $13.1B. Analysts expected EPS of $1.19 on revenue of $12.9B. The stock rose 46¢ & will be splitting 2-1 shortly.
Coca-Cola Profit Tops Estimates After Higher Pricing

Big Ben predicts slow progress on unemployment & offered no hints of easing in his testimony before Congress. The markets, expecting magical cures for fundamental economic problems, sold off. Earnings reports will dominate the markets this week. It looks like we're back to lower earnings that beat estimates are "good enough" for the markets. Markets remain fragile.

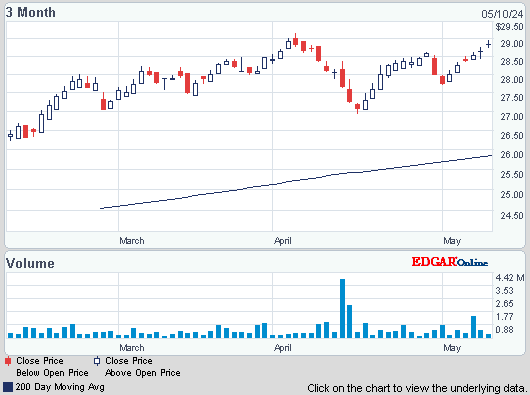
AMJ (Alerian MLP Index tracking fund)
Treasury yields:
U.S. 3-month | 0.092% | |
U.S. 2-year | 0.238% | |
U.S. 10-year | 1.489% |
| CLQ12.NYM | ...Crude Oil Aug 12 | ...88.92 | ... | (0.6%) |
| GCN12.CMX | ...Gold Jul 12 | .......1,587.70 | .... | (0.2%) |
Get the latest daily market update below:
Intl demand for US financial assets rose in May as investors sought shelter from the European debt mess. Net buying of long-term equities, notes & bonds totaled $55B during the month (a bad month for the stock market), compared with net purchases of $27B in Apr according to the Treasury Dept. Projections were for net buying of $41B. Including short-term securities such as stock swaps, foreigners bought a net $101B in May, compared with net selling of $8.2B in Apr. US assets have maintained their attraction as EU leaders grapple with a financial crisis that has pushed up Italian borrowing costs while the euro area bails out Spanish banks. China's growth slowed for a 6th qtr to the weakest pace since the global financial crisis, while the IMF said the world economy will increase 3.9% next year, down from 4.1% projected in Apr. Foreign buying of securities has likely continued strong, helping markets rebound in the last month.
International Demand for U.S. Assets Rises on Europe Crisis

US industrial production rose in Jun as factories made more cars, machines & business equipment. Factory output recovered to levels reached earlier this spring but appears to be leveling off. The Federal Reserve (FED) says factory output rose 0.7% last month, after falling by the same amount in May. Factories produced more machines & vehicles used by businesses. Auto production rebounded after its first decline of the year. Factories are a crucial contributor to economic expansion & their strong results in Jun follow a period of shaky growth when factory output fell in 2 of the past 4 months. The FED says factory growth in Q2 slowed to an annual rate of 1.4%, after leaping 9.8% in Q1. Hiring by manufacturers also slowed in recent months. Better news but the economic recovery remains iffy.
Industrial Production in U.S. Rises in Sign of Resilienc

The Coca-Cola, a Dow stock & Dividend Aristocrat, net income slipped in Q2, as rising costs for ingredients offset its expansion overseas. Revenue growth was powered by emerging markets such as India, where volume rose 20%, but was offset by higher costs for ingredients, rising 5% from a year ago, & weakness in Europe where several regions there suffered from economic uncertainty & poor weather. Its sales volume fell 4%. In the US, sales volume rose 1%, while a mix of higher prices & a variety of smaller bottles & cans helped lift revenue 5%. However, volume for its flagship sparkling beverages (Coke & Sprite) fell 2%. As soda consumption in the US continues to decline, KO has increasingly been looking past its namesake drink for growth. The company said volume of its still beverages, such as Powerade & Smartwater, rose 8% in Q2. Its juice brands rose 3%, driven by growth in lower-calorie Minute Maid offerings. Given the saturated US market, KO is also increasingly pinning its fortunes on intl markets where the ranks of middle-class consumers are multiplying at a rapid clip by establishing an early dominance in foreign markets that could help determine its growth trajectory in the years to come. Last month, for example, the company said it would accelerate its investment in India to $5B over the next 8 years, more than double the $2B it invested since re-entering the country in 1993. In Q2, EPS was $1.21, slightly below $1.20 last year (when there were more outstanding shares). Not including one-time items, EPS was $1.22. Revenue rose 3% to $13.1B. Analysts expected EPS of $1.19 on revenue of $12.9B. The stock rose 46¢ & will be splitting 2-1 shortly.
Coca-Cola Profit Tops Estimates After Higher Pricing
Coca-Cola (KO)
Big Ben predicts slow progress on unemployment & offered no hints of easing in his testimony before Congress. The markets, expecting magical cures for fundamental economic problems, sold off. Earnings reports will dominate the markets this week. It looks like we're back to lower earnings that beat estimates are "good enough" for the markets. Markets remain fragile.
Dow Jones Industrials
Get your favorite symbols' Trend Analysis TODAY!


No comments:
Post a Comment