Dow finished down 31, decliners ahead of advancers 5-4 & NAZ dropped 21. The Financial Index fell 2 to the 192s. The MLP index was up a fraction in the 388s, continuing its winning ways over the last month, & the REIT index rose 1½ to the 264s, close to its yearly highs. Junk bond funds sold off but Treasuries were higher, bringing yields near record lows. Oil rose after the US announced more sanctions on Iran. As its chart shows below, gold has lost its way & remains near its yearly lows.

![Live 24 hours gold chart [Kitco Inc.]](http://www.kitco.com/images/live/gold.gif)

China's new loans exceeded estimates in Jun, boosting odds the gov will secure an economic rebound after growth probably slowed for a 6th qtr. Banks extended 919.8B yuan ($144.3B) of local-currency loans, accoridng to the the People’s Bank of China, more than the 880B yuan forecast. Foreign-exchange reserves fell to $3.2T on Jun 30, a record quarterly decline. The pickup in lending bolsters Premier Wen Jiabao's case that easing policies, including the first interest-rate cuts since 2008, are showing results & that the economy has stabilized. The gov is expected to show Q2 growth of 7.7%, a 3-year low. Officials are expected to reduce banks’ reserve requirements this month after 3 cuts times since Nov. Yuan deposits increased 2.86T yuan in Jun, 49% more last year. China watching is new for most as it copes with a slower rate of economic.
China New Yuan Loans Top Forecasts; Forex Reserves Shrink
The US budget deficit grew by nearly $60B in Jun, remaining on track to exceed $1T for the 4th straight year. Thru the first 9 months of the budget year, the federal deficit totaled $904B, the Treasury reported. Dems & Reps remain at odds over how to lower the deficit: disagreeing on how much to spend, where to cut & whether tax increases should be on the table. The gridlock has left a package of expiring tax cuts & scheduled spending increases in limbo, another threat to an already weak economy. The Congressional Budget Office predicts the deficit for the full year (ending Sep 30) will total $1.17T, a slight improvement from the $1.3T recorded in 2011, but still greater than any deficit before Obama took office. A trade deficit is bad for the economy, because it means those purchases were did not come from US suppliers.
U.S. Records $904.2B Deficit Through June
PC sales sagged during the spring as shifting technology trends, upcoming product releases & a shaky economy dampened demand for PCs on the market. The Q2 decline in the US ranged from 6-11% compared with the same time last year, according to Gartner & International Data. Gartner came up with the lower of the 2 figures in the research firms' quarterly look at shipments of desktop & laptop computers. Worldwide shipments held up better, dipping by just 0.1% from last year. This marks the 7th consecutive qtr in which global PC shipments have either decreased or edged up only slightly from the previous year. Hewlett-Packard (HPQ), a Dow stock, & Dell (DELL), the biggest PC makers in the US market, suffered the steepest drops during Q2. HPQ shipments in the US fell 12-13% while DELL sales decreased about 9%. Consumers & businesses have been buying fewer PCs amid the growing popularity of smartphones & tablets. The PC market has become mature. HPQ fell 34¢ & DELL was off 15¢.
PC Sales Fall 6% to 11%


Very little went on as the markets await earnings & developments in Europe. JPMorgan (JPM) will get the bulk of attention tomorrow & that will be followed by reports from more big banks next week. Prospects for encouraging earnings are not good. There was buying late in the day, reducing losses & bringing averages near break even. But into the close, selling returned. Dow has declined for 6 days, all mild losses, & is just above the 12.5K low in late Jun.

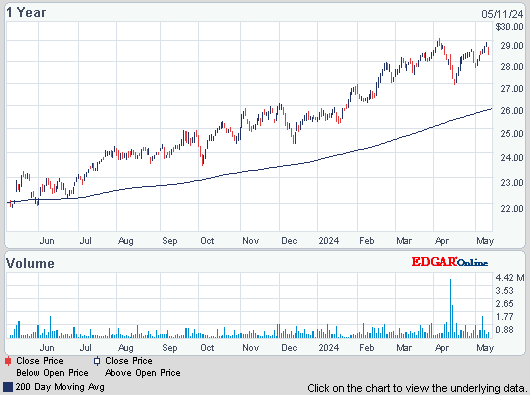
AMJ (Alerian MLP Index tracking fund)
Click below for the latest market update:
Treasury yields:
U.S. 3-month | 0.096% | |
U.S. 2-year | 0.258% | |
U.S. 10-year | 1.479% |
| CLQ12.NYM | ...Crude Oil Aug 12 | ...86.14 | ... | (0.4%) |
![Live 24 hours gold chart [Kitco Inc.]](http://www.kitco.com/images/live/gold.gif)

China's new loans exceeded estimates in Jun, boosting odds the gov will secure an economic rebound after growth probably slowed for a 6th qtr. Banks extended 919.8B yuan ($144.3B) of local-currency loans, accoridng to the the People’s Bank of China, more than the 880B yuan forecast. Foreign-exchange reserves fell to $3.2T on Jun 30, a record quarterly decline. The pickup in lending bolsters Premier Wen Jiabao's case that easing policies, including the first interest-rate cuts since 2008, are showing results & that the economy has stabilized. The gov is expected to show Q2 growth of 7.7%, a 3-year low. Officials are expected to reduce banks’ reserve requirements this month after 3 cuts times since Nov. Yuan deposits increased 2.86T yuan in Jun, 49% more last year. China watching is new for most as it copes with a slower rate of economic.
China New Yuan Loans Top Forecasts; Forex Reserves Shrink
The US budget deficit grew by nearly $60B in Jun, remaining on track to exceed $1T for the 4th straight year. Thru the first 9 months of the budget year, the federal deficit totaled $904B, the Treasury reported. Dems & Reps remain at odds over how to lower the deficit: disagreeing on how much to spend, where to cut & whether tax increases should be on the table. The gridlock has left a package of expiring tax cuts & scheduled spending increases in limbo, another threat to an already weak economy. The Congressional Budget Office predicts the deficit for the full year (ending Sep 30) will total $1.17T, a slight improvement from the $1.3T recorded in 2011, but still greater than any deficit before Obama took office. A trade deficit is bad for the economy, because it means those purchases were did not come from US suppliers.
U.S. Records $904.2B Deficit Through June
PC sales sagged during the spring as shifting technology trends, upcoming product releases & a shaky economy dampened demand for PCs on the market. The Q2 decline in the US ranged from 6-11% compared with the same time last year, according to Gartner & International Data. Gartner came up with the lower of the 2 figures in the research firms' quarterly look at shipments of desktop & laptop computers. Worldwide shipments held up better, dipping by just 0.1% from last year. This marks the 7th consecutive qtr in which global PC shipments have either decreased or edged up only slightly from the previous year. Hewlett-Packard (HPQ), a Dow stock, & Dell (DELL), the biggest PC makers in the US market, suffered the steepest drops during Q2. HPQ shipments in the US fell 12-13% while DELL sales decreased about 9%. Consumers & businesses have been buying fewer PCs amid the growing popularity of smartphones & tablets. The PC market has become mature. HPQ fell 34¢ & DELL was off 15¢.
PC Sales Fall 6% to 11%
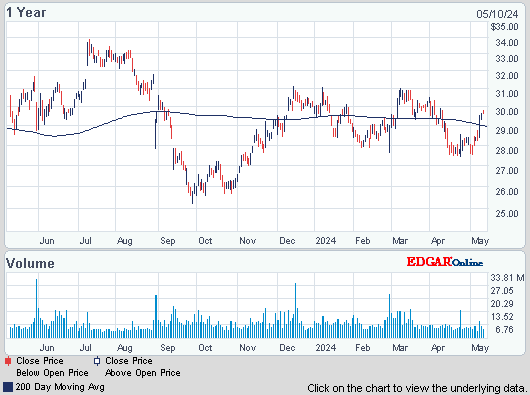
Hewlett-Packard (HPQ)
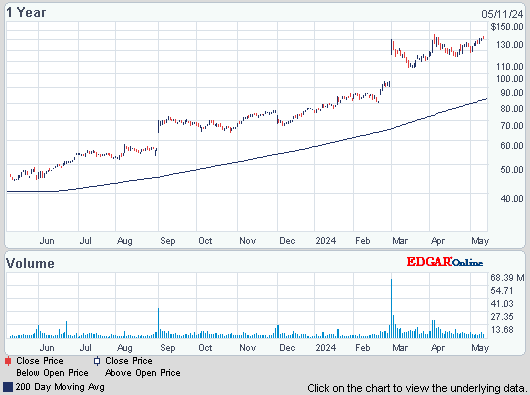
Dell (DELL)
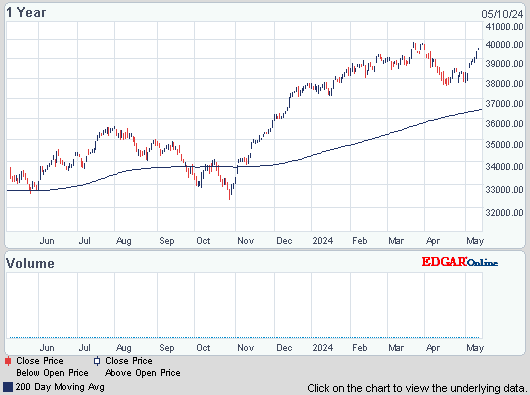
Very little went on as the markets await earnings & developments in Europe. JPMorgan (JPM) will get the bulk of attention tomorrow & that will be followed by reports from more big banks next week. Prospects for encouraging earnings are not good. There was buying late in the day, reducing losses & bringing averages near break even. But into the close, selling returned. Dow has declined for 6 days, all mild losses, & is just above the 12.5K low in late Jun.
Dow Jones Industrials
Get your favorite symbols' Trend Analysis TODAY!


No comments:
Post a Comment