

Dow edged up 6, decliners over advancers 5-4 & NAZ was off 8. The MLP index went up 2+ to over 460 (still in its sideways trading pattern for much of the year) & the REIT index was up fractionally to the 266s. Junk bond funds slipped lower & Treasuries inched higher. Oil continues to hover aoround 100 & gold is trying to hang in above 1200 in what has been a terrible year.
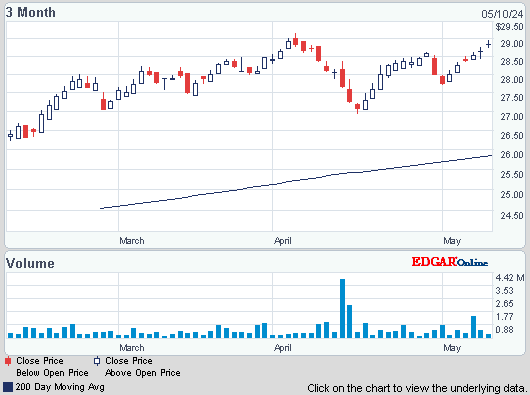
AMJ (Alerian MLP Index tracking fund)


Contracts to purchase previously owned US homes rose less than forecast in Nov, indicating higher borrowing costs are holding back the recovery in residential real estate. A gauge of pending home sales increased 0.2%, the first gain in 6 months, after a 1.2% drop in Oct that was larger than initially reported, the National Association of Realtors (NAR) said. The median called for a 1% advance. Higher mortgage rates, tight lending standards & price increases driven by a limited supply of homes for sale are discouraging prospective buyers. Further gains in hiring, household wealth & consumer confidence would help boost the housing recovery & give greater momentum to the economy. Purchases dropped 4% from the year prior on an unadjusted basis after a 2.7% decrease in the 12 months ended in Oct, the NAR reported. The pending sales index was 101.7 on a seasonally-adjusted basis. A reading of 100 corresponds to the average level of contract activity in 2001, or “historically healthy” home-buying traffic. Pending home sales are a leading indicator because they track contract signings. Existing home sales are tabulated when a contract closes, usually a month or 2 later. The NAR projects 2013 will be the best year in 7 for existing home sales, with an estimated 5.1M transactions.
Pending Sales of U.S. Existing Homes Rise Less Than Forecast

Photo: Bloomberg
Calls for China to accelerate financial reforms grew louder after figures showed its indebted local govs owe nearly $3T in a debt build-up that some consider alarming. The National Audit Office, China's state auditor, said that local govs had total outstanding debt of 17.9T yuan at the end of Jun, a sum that includes contingent liabilities & debt guarantees. The debt load is in the middle of market forecasts & leaves China with total gov debt of around 58% of GDP. Analysts said this suggested China is not on a verge of a fiscal crisis, the figure is less than half the debt burdens in Japan & Greece where public finances are strained, but warned the that the economy needed to urgently reduce debt if it wanted to safeguard growth & financial stability because the report showed some govs were using new loans to repay more than a 1/5 of their debt, & that authorities still relied heavily on selling land to pay off old loans. China's mountain of local gov debt is among the biggest threats to its economy as investors worry a good part of it cannot be repaid since most of the money borrowed had paid for non-lucrative public infrastructure. The prospect of defaults has raised fears that they could saddle Chinese banks with a load of bad debt & destabilise China's financial system. Beijing acknowledges the risks & promised to curtail fiscal dangers by revising policies. New policies include letting investors pay for the building of some public works, allowing govs to tap more financing sources, & pegging performances of governments to total debt incurred.
Stocks are doing very little on low volume. As was the case last week, some traders are taking extended weekends. This has been nothing short of an outstanding year for popular stock averages, but yield sensitive stocks have not fared as well. Money has flowed out of commodities, especially gold, into stocks. A new year will bring new trends.
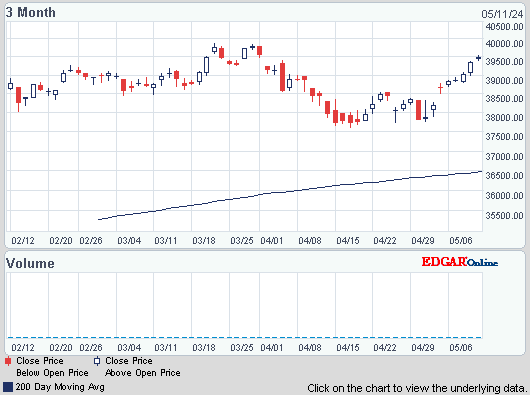
Dow Jones Industrials
AMJ (Alerian MLP Index tracking fund)
Treasury yields:
U.S. 3-month |
0.05% | |
U.S. 2-year |
0.38% | |
U.S. 10-year |
2.98% |
| CLG14.NYM | ...Crude Oil Feb 14 | ...100.01 | (0.3%) |
| GCF14.CMX | ...Gold Jan 14 | ........1,204.50 | (0.8%) |
Contracts to purchase previously owned US homes rose less than forecast in Nov, indicating higher borrowing costs are holding back the recovery in residential real estate. A gauge of pending home sales increased 0.2%, the first gain in 6 months, after a 1.2% drop in Oct that was larger than initially reported, the National Association of Realtors (NAR) said. The median called for a 1% advance. Higher mortgage rates, tight lending standards & price increases driven by a limited supply of homes for sale are discouraging prospective buyers. Further gains in hiring, household wealth & consumer confidence would help boost the housing recovery & give greater momentum to the economy. Purchases dropped 4% from the year prior on an unadjusted basis after a 2.7% decrease in the 12 months ended in Oct, the NAR reported. The pending sales index was 101.7 on a seasonally-adjusted basis. A reading of 100 corresponds to the average level of contract activity in 2001, or “historically healthy” home-buying traffic. Pending home sales are a leading indicator because they track contract signings. Existing home sales are tabulated when a contract closes, usually a month or 2 later. The NAR projects 2013 will be the best year in 7 for existing home sales, with an estimated 5.1M transactions.
Pending Sales of U.S. Existing Homes Rise Less Than Forecast
Calls for China to accelerate financial reforms grew louder after figures showed its indebted local govs owe nearly $3T in a debt build-up that some consider alarming. The National Audit Office, China's state auditor, said that local govs had total outstanding debt of 17.9T yuan at the end of Jun, a sum that includes contingent liabilities & debt guarantees. The debt load is in the middle of market forecasts & leaves China with total gov debt of around 58% of GDP. Analysts said this suggested China is not on a verge of a fiscal crisis, the figure is less than half the debt burdens in Japan & Greece where public finances are strained, but warned the that the economy needed to urgently reduce debt if it wanted to safeguard growth & financial stability because the report showed some govs were using new loans to repay more than a 1/5 of their debt, & that authorities still relied heavily on selling land to pay off old loans. China's mountain of local gov debt is among the biggest threats to its economy as investors worry a good part of it cannot be repaid since most of the money borrowed had paid for non-lucrative public infrastructure. The prospect of defaults has raised fears that they could saddle Chinese banks with a load of bad debt & destabilise China's financial system. Beijing acknowledges the risks & promised to curtail fiscal dangers by revising policies. New policies include letting investors pay for the building of some public works, allowing govs to tap more financing sources, & pegging performances of governments to total debt incurred.
Stocks are doing very little on low volume. As was the case last week, some traders are taking extended weekends. This has been nothing short of an outstanding year for popular stock averages, but yield sensitive stocks have not fared as well. Money has flowed out of commodities, especially gold, into stocks. A new year will bring new trends.
Dow Jones Industrials


No comments:
Post a Comment