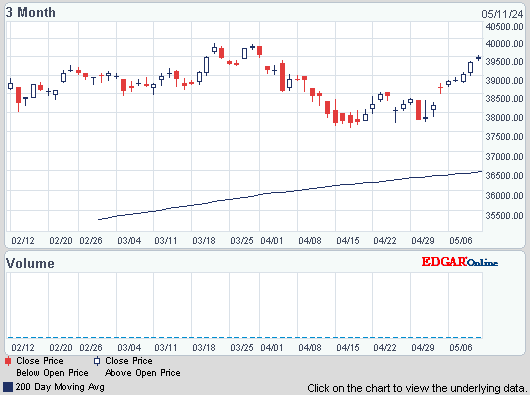
Dow jumped 72 & closed near the high, advancers over decliners 2-1 & NAZ gained 22. The MLP index went up 2+ to the 464s, the high end of its 10 month trading range & near the record reached earlier in 2013, & the REIT index slipped 1 to the 265s. Junk bond funds were flattish. again trading sideways for months, & Treasuries saw selling again. Oil pulled back & gold was barely able to hang in above 1200.
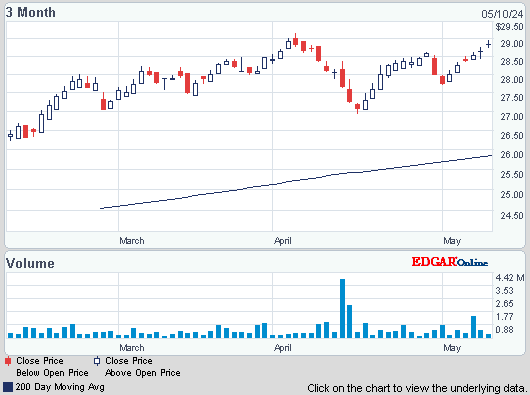
AMJ (Alerian MLP Index tracking fund)

![Live 24 hours gold chart [Kitco Inc.]](http://www.kitco.com/images/live/gold.gif)

Home prices in 20 US cities rose in Oct from a year ago by the most in more than 7 years,. The S&P/Case-Shiller index of property prices in 20 cities climbed 13.6% from Oct 2012, the biggest 12-month gain since Feb 2006, after a 13.3% increase in the year ended in Sep. The projection called for a 13.5% advance. A dwindling inventory of foreclosed properties has helped restrict the supply of homes for sale, pushing up prices even as higher mortgage rates cool demand. The real-estate market will probably get its next boost from gains in employment that are lifting consumer confidence in the economic expansion. Home prices adjusted for seasonal variations rose 1% in Oct from the prior month, the same as in Sep. Property values rose in all 20 metropolitan areas, with the smallest gain coming in at 0.3% in Denver. However this is lagging data & advances in home equity may be harder to come by as Federal Reserve begins to trim stimulus, causing mortgage rates to climb.
Home Prices in 20 U.S. Cities Rise Most in Seven Years, Case-Shiller Says
Treasuries fell, pushing 10 year yields to the highest level in more than 2 years, as gains in consumer confidence & home sales bolstered bets the Federal Reserve (FED) will end bond purchases next year. 30 year bond yields also reached the highest since 2011. Treasuries are having the first annual loss since 2009 amid signs the recovery will prove resilient as the FED tapers asset-buying. 10 year yields have jumped 1.2 percentage points this year to 3% & will rise to 3.4% by the end of 2014, according to recent survey. The 10 year yield climbed 6 basis points to 3.03%,the highest since Jul 2011. Yields on 30 year Treasury bond jumped 7 basis points to 3.97%, the highest level since Aug 2011. US gov securities maturing in 10 years or more have slumped 12% this year, the most among all of the 144 gov bond indexes globally.
U.S. 10-Year Yield Climbs to 2-Year High as Data Stoke Fed Bets
The strength in the popular averages during 2013 masks an underlying weakness in the stock market. Most regular stocks did well while yield stocks, especially in H2, were flat to lower in anticipation of higher interest rates. Dow rose a startling 27%, one of its best year in history, primarily because of cheap money. That period is winding down & it will be difficult to approach that kind of return in 2014. In the meantime, enjoy the new year!!
Dow Jones Industrials

AMJ (Alerian MLP Index tracking fund)
Treasury yields:
U.S. 3-month |
0.07% | |
U.S. 2-year |
0.38% | |
U.S. 10-year |
3.03% |
| CLG14.NYM | ....Crude Oil Feb 14 | ....98.50 | (0.8%) |
![Live 24 hours gold chart [Kitco Inc.]](http://www.kitco.com/images/live/gold.gif)

Home prices in 20 US cities rose in Oct from a year ago by the most in more than 7 years,. The S&P/Case-Shiller index of property prices in 20 cities climbed 13.6% from Oct 2012, the biggest 12-month gain since Feb 2006, after a 13.3% increase in the year ended in Sep. The projection called for a 13.5% advance. A dwindling inventory of foreclosed properties has helped restrict the supply of homes for sale, pushing up prices even as higher mortgage rates cool demand. The real-estate market will probably get its next boost from gains in employment that are lifting consumer confidence in the economic expansion. Home prices adjusted for seasonal variations rose 1% in Oct from the prior month, the same as in Sep. Property values rose in all 20 metropolitan areas, with the smallest gain coming in at 0.3% in Denver. However this is lagging data & advances in home equity may be harder to come by as Federal Reserve begins to trim stimulus, causing mortgage rates to climb.
Home Prices in 20 U.S. Cities Rise Most in Seven Years, Case-Shiller Says
Treasuries fell, pushing 10 year yields to the highest level in more than 2 years, as gains in consumer confidence & home sales bolstered bets the Federal Reserve (FED) will end bond purchases next year. 30 year bond yields also reached the highest since 2011. Treasuries are having the first annual loss since 2009 amid signs the recovery will prove resilient as the FED tapers asset-buying. 10 year yields have jumped 1.2 percentage points this year to 3% & will rise to 3.4% by the end of 2014, according to recent survey. The 10 year yield climbed 6 basis points to 3.03%,the highest since Jul 2011. Yields on 30 year Treasury bond jumped 7 basis points to 3.97%, the highest level since Aug 2011. US gov securities maturing in 10 years or more have slumped 12% this year, the most among all of the 144 gov bond indexes globally.
U.S. 10-Year Yield Climbs to 2-Year High as Data Stoke Fed Bets
The strength in the popular averages during 2013 masks an underlying weakness in the stock market. Most regular stocks did well while yield stocks, especially in H2, were flat to lower in anticipation of higher interest rates. Dow rose a startling 27%, one of its best year in history, primarily because of cheap money. That period is winding down & it will be difficult to approach that kind of return in 2014. In the meantime, enjoy the new year!!
Dow Jones Industrials
I’m a huge fan of INO & from what I have seen so far, their service Marketclub! This isn’t a stripped down version, everything in MarketClub is available to you. I don’t want to give everything away, but you’ll have unlimited access to my favorite 3 tools: Trade Triangles, Smart Scan & Alerts!
The best part is that the MarketClub customer support team will be providing UNLIMITED support!
You can call or email for an instant response to any question, comment or concern.
Here’s that link:
https://club.ino.com/join/specialtrial/index_free.html?a_aid=CD3289&a_bid=359ef9a3
I’d recommend you jump on this now.


No comments:
Post a Comment