Showing posts with label home builders. Show all posts

Wednesday, August 15, 2012

Markets vacillate following favorable factory data

Dow lost 9, advancers ahead of decliners 5-4 & NAZ was up 8.  The Financial Index was up a fraction in the 201s, near 3 month highs.  The MLP index fell a fraction to 391 while the REIT index was up 1 to the 263s.  Junk bond funds inched higher & Treasuries pulled back again, taking the yield on the 10 year Treasury bond up almost 40 basis points from its recent record lows.  Oil slipped & gold was a little higher. 
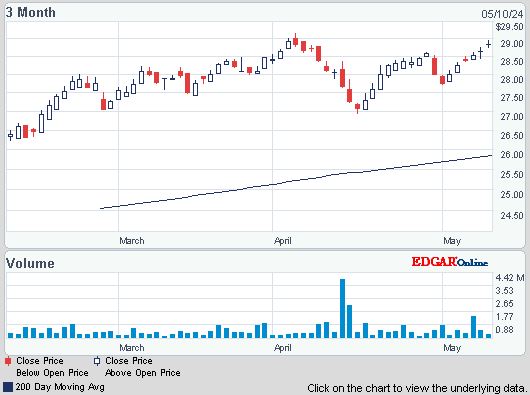
AMJ (Alerian MLP Index tracking fund)


stock chart

Treausry yields:

U.S. 3-month

0.097%

U.S. 2-year

0.281%

U.S. 10-year

1.779%

CLU12.NYM...Crude Oil Sep 12...92.95 ...Down 0.48  (0.5%)

GCQ12.CMX...Gold Aug 12.....1,599.70 ....Up 0.30  (0.0%)


Get the latest daily market update below:


Homebuilder Confidence in U.S. Rose in August to Five-Year High

Photo:   Bloomberg

US homebuilders grew more confident in the housing recovery in Aug, as many reported that prospects for sales are the best they've been since the home bubble burst 5 years ago.  The National Association of Home Builders/Wells Fargo builder sentiment index rose 2 points to 37, up from 35 in Jul.  That's the highest reading since Mar 2007.  The index, which is based on responses from 478 builders, has risen steadily since Jan.  Any reading below 50 indicates negative sentiment about the housing market & the index hasn't reached that level since Apr 2006, the peak of the housing boom.  Another indication that the housing market is on the mend.


Industrial Production in U.S. Rises 0.6% on Autos, Utilities

Photo:   Bloomberg

US factories made more cars, computers & airplanes last month, a hopeful sign that manufacturing is recovering after a weak spring.  Industrial production, which includes output at factories, mines & utilities increased 0.6% in Jul from Jun, the 4th straight monthly increase, according to the Federal Reserve.  Factory output, the most important component, rose 0.5%, the 2nd straight increase.  Factory output has risen 21.9% since its recession low in Jun 2009 & is just 1.7% below the pre-recession peak for factory output reached in Apr 2007.  The Jul increase was led by a 3.3% surge in output of motor vehicles & parts.  Production of computers & primary metals such as steel also showed big gains.   Mining output, which includes oil & gas production as well as coal mining, increased 1.2%. Utility output rose 1.3%, largely because of hot weather in many parts of the country.  Manufacturing has slowed this spring as consumers cut back on spending & businesses invested less in machinery & equipment.  In another report, a survey from the Federal Reserve Bank of New York showed manufacturing conditions in the New York region shrank in Aug.  The Empire State index fell to -5.9, down from a reading of 7.4 in Jul.

Industrial Production in U.S. Rises 0.6% on Autos, Utilities


Target Quarterly Profit Tops Estimates as Store Sales Gain

Photo:   Bloomberg

Target, a Dividend Aristocrat, had higher net income in Q2 as it paves the way for an upcoming move into Canada.  It saw solid spending by customers & it raised its outlook for the year.  TGT has reached out to customers with 2 growth initiatives: offering a larger selection of foods & also a program started in 2010 which gives shoppers a 5% discount when they pay with Target-branded credit & debit cards.  It has also expanded into urban markets using smaller versions of its big-box stores.  It is pleased with the performance of its first 3 locations & is looking outside the country for growth as well.  TGT will soon begin opening the first of 125-135 stores at store locations once owned by Zellers, Canada's 2nd-largest discount chain.  EPS was $1.06 which compares with $1.03 last year.  Excluding expenses tied to Canada, EPS was $1.12, topping expectations of $1.01.  Overall revenue rose 3.5% to $16.5B.  Analysts forecasted $16.75B.  Revenue at stores opened at least a year rose 3.1%.  The company expects EPS in Q3 to be 83-93¢ & analysts expect 77¢.  TGT also raised its EPS guidance for the year by a nickel to $4.65-$4.85.  Analysts are expecting $4.30.  The stock gained 1.26 & has done well in the last year.
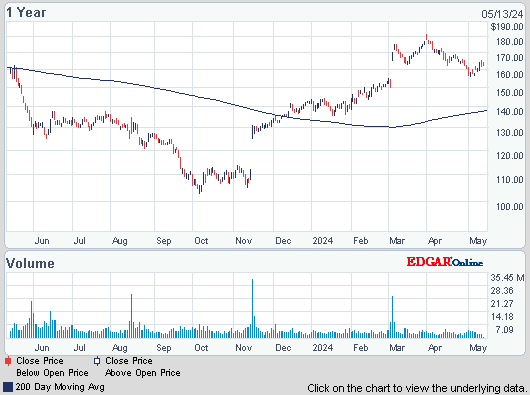
Target (TGT)


stock chart


Markets continue to meander looking for direction in a quiet month.  There is no dramatic news coming out, partially because Europe is on summer holiday.  But its problems have not gone away.  US economic news is a little better than it has been.  But year end is approaching & the possibility of significant tax hikes is keeping business & consumers cautious about the outlook.  Dow stays near 13K, unable to break thru its high at 13.4K.  That trend should remain thru the end off Aug.
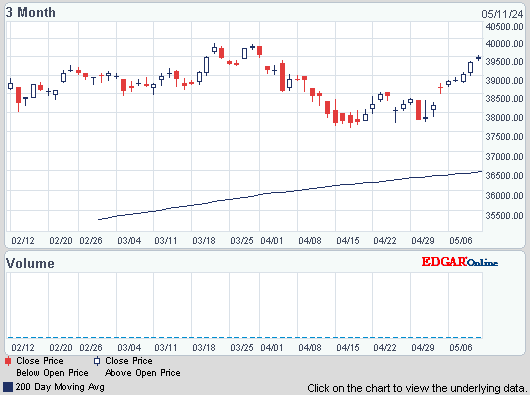
Dow Jones Industrials


stock chart


Get your favorite symbols' Trend Analysis TODAY!  


Monday, June 18, 2012

Markets meander after Greek election

Dow fell 37, decliners just ahead of advancers 2-1 & NAZ was up 4.  The Financial Index slid a fraction to the 192s. 

The MLP index fell 2 to 360 & the REIT index rose 2 to the 255s (9 below the yearly highs).  Junk bond funds edged higher & Treasuries were little changed.  Oil fell back & gold was also weaker on the confusion coming from Europe.

AMJ (Alerian MLP index tracking fund)


stock chart

Treasury yields:

U.S. 3-month

0.086%

U.S. 2-year

0.282%

U.S. 10-year

1.570%

CLN12.NYM....Crude Oil Jul 12...82.67 .....Down 1.36  (1.6%)

GCM12.CMX...Gold Jun 12.....1,616.00 ...Down 11.00  (0.7%)


Get the latest daily market update below:


Greece may have survived the vote, but it could be set up to fail.  An election ended expectations of an imminent euro exit but left the threat hanging over the global economy & put European leaders under pressure to speed efforts to protect the rest of the region.  Spanish 10-year bond yields soared above 7% for the first time in the euro era.  Greece which is dependent on emergency loans from the EU & IMF, still has to meet the creditors’ conditions to keep the aid flowing.  The route to continued support involves axing €11.5B ($14.5B) from the budget & 150K civil service jobs.  To form a parliamentary majority, Greece’s 2 traditional political rivals, New Democracy, led by Antonis Samaras, & the Socialist Pasok party, led by Evangelos Venizelos, must form a coalition. Conditions are tense.  Greece, mired in a 5th year of recession, has been ordered to enact promised spending cuts in return for €240B in rescue packages since 2010.  This continues to be a mess with no end in sight.

Greek Election Leaves Pyrrhic Victory Risk as Bailout Talks Near


Spanish Economy Minister Luis de Guindos

Luis de Guindos, Spain's economy minister
Photo:   Bloomberg

Investors who oversee more than $3.2T expect Spain to become the 4rth euro member to need external funding as borrowing costs surge to levels too punitive for the nation to finance its needs.  Spanish debt has slumped, pushing the yield on the 10-year bond to a euro-era record of 7.14%.  The bonds are the worst performers among 26 developed markets since Jun 9, when Economy Minister Luis de Guindos said he would request as much as €100B ($127B) of emergency loans to shore up a Spanish banking system hobbled by bad assets.  Prime Minister Rajoy called on Europe's policy makers last week to do more to support Spanish bonds after the bank rescue failed to halt yields from climbing to levels at which Greece, Portugal & Ireland needed to seek help.  His gov is battling to reduce the the debt load as the recession deepens, leaving the jobless rate at more than 24%.  Spain’s 10-year bond rate has surged more than 2 percentage points from this year’s Mar 1 low. The yield climbed 26 basis points today.  The nation’s bonds also risk incurring higher trading costs at LCH Clearnet as their performance relative to Europe’s AAA rated benchmark deteriorates.  LCH, Europe’s biggest clearing house, increased the cost of trading Irish & Portuguese bonds by 15% when yield spreads for those securities climbed above 450 basis points. This is another disaster that G-20 will have to deal with this week.

Spanish Yields at 7% Show Investors Slamming Door: Euro Credit


Confidence among US builders ticked up in Jun to a 5-year high, an indication that the housing market is slowly improving.  The National Association of Home Builders/Wells Fargo builder sentiment index rose to 29, the highest reading since May 2007.  It increased from last month, which was revised down one point.  The index has risen in 7 of the past 9 months.  Still, any reading below 50 indicates negative sentiment about the housing market (last reached in Apr 2006, the peak of the housing boom).  Builders reported seeing the best sales level since Apr 2007, according to a separate measure in the survey.  Their outlook for sales in the next 6 months, however, hasn't changed from May.  The modest improvement among builders follows other signs that suggest the housing market could be slowly starting to recover.  In Apr, sales of both previously occupied homes & new homes rose near 2-year highs. Builders are breaking ground on more homes & requesting more permits to build single-family homes later this year.  And cheaper mortgages along with lower home prices in many markets have made home buying more attractive.  Still, the pace of home sales remains well below healthy levels.  Good news in housing is always welcome.

Homebuilder Confidence in U.S. Climbs to Five-Year High


Last night, Dow futures rallied on news about the Greek election.  But the rally was muted.  In pre-market trading, the futures were lower, pretty much where they are now.  It looks like Greece will remain in the euroe-zone, one level of comfort.  But that hardly solves problems.  Spain could care less about the elections where every day it's a matter of going from bad to worse.  G-20 meets this week, maybe they can figure out some way to be of help.  But I wouldn't bet on it.  Then there's the FOMC meeting where the bulls are hoping for Big Ben to come up with more magic.  I don't think so, at least this time.  Dow has had a nice bounce off its lows, but that rally is looking tired already.

Dos Jones Industrials


stock chart


Get your favorite symbols' Trend Analysis TODAY!  

Monday, April 16, 2012

Mixed markets on mixed earnings

Dow gained 63 although off its best levels, decliners just ahead of advancers & NAZ slumped 18, hurt by a drop of 11 (to 594) at Apple (AAPL).  The Financial Index was up 1 to the 204s.  The MLP index fell a fraction to 387 & the REIT index went up 1+ to almost 250.  Junk bond funds were higher & Treasuries rose on more uncertainty about Spanish debt.  Oil & gold did little.

JPMorgan Chase Capital XVI (AMJ)


stock chart

Treasury yields:

U.S. 3-month

0.081%

U.S. 2-year

0.270%

U.S. 10-year

1.960%

CLK12.NYM..Crude Oil May 12...102.81 ...Down 0.02  (0.0%)

GCJ12.CMX...Gold Apr 12.........1,654.50 ...Down 4.60  (0.3%)


Get the latest daily market update below:


Europe Seeks Bigger IMF War Chest

Bank of Spain
Photo:   Bloomberg

Spain's debt yields broke above 6% as investors worried about its budget, knocking the € & sending safe-haven German bonds to a record last set at the height of the euro zone crisis.  Mixed signals from the ECB over its willingness to help the market by restarting a special bond buying program & news Spanish banks have been heavy borrowers of cheap ECB funds also undermined confidence.  Spain's 10-year bonds were up 16 basis points at 6.15%, 5-year yields topped 5%, while 2-year yields spiked to 3.7%, all highs for this year.  6% was last reached in Dec & is psychologically important for markets.  The rise typically accelerates after that level, putting yields on course for 7% beyond which debt costs are seen as unsustainable.  The cost of insuring Spanish debt against default also hit record highs in early trading.  Contagion fears also pushed Italian 10-year bonds higher.  European officials are traveling to DC seeking a bigger global war chest to combat the debt crisis to help Spain's gov battle market turmoil over its finances.  Can you spell, "Greece II?"

Euro Area Seeks Bigger IMF War Chest on Spanish Concerns


The outlook for homebuilders dimmed in Apr after 6 months of rising or steady confidence, suggesting the housing market remains weak despite modest gains.  The National Association of Home Builders/Wells Fargo builder sentiment index fell this month to 25 from 28.  Last month's reading was the highest since Jun 2007.  The index rose for 5 straight months between Sep & Feb.  Builders expressed weaker confidence in sales over the next 6 months.  A separate gauge measuring that outlook rose for 6 straight months before falling this month, from 35 to 32.  Any reading below 50 indicates negative sentiment about the housing market & the index hasn't reached hit that level in 6 years.  The spring buying season got an early start thanks to a mild Jan & Feb, which made up the best winter for sales of previously occupied homes in 5 years.  Permits to build houses & apartments rose in Feb to their highest level since 2008.  But home prices continued to fall as builders keep slashing their prices to stay competitive.  Last year was the worst for new-home sales on records dating back to 1963.

U.S. Homebuilder Outlook Dips Below 4-Year High

  • <p>               FILE - This Oct. 13, 2011 file photo, shows a Citibank branch in New York. Citigroup reported Monday, April 16, 2012, a profit of $2.9 billion for the first three months of the year. The bank says it collected record revenue from processing international transactions by other companies. It was hurt by an accounting charge of $1.3 billion as the value of its debt increased. (AP Photo/Mark Lennihan, File)
Photo:   Yahoo

Citigroup made $2.9B in Q1, helped by record revenue from processing transactions for its intl clients & more customers paying back loans on time.  EPS was 95¢, short of the $1.01 expected.  The bank pointed to a separate figure for EPS, $1.11 per share, that does not include a $1.3B accounting charge that Citi took because the value of its debt increased.  Revenue was $19.4B, down 2% from a year earlier.  Citi took advantage of increased intl trade & its intl transaction services had quarterly revenue of $2.7B, up 7% from last year.  Because more customers paid on time, the bank took a profit of $1.2B from reversing reserves it had set aside for loan losses.  Customer loans late by at least 90 days, including credit card payments, fell 19% from a year ago.  But investment banking revenue fell 12% to $5.3B because volume in the stock market has been light this year . Citi's equity markets revenue fell 18%.  Q1 results continued a stream of profits in the past 2 years, which gave CEO Vikram Pandit enough confidence to promise shareholders a higher div.  However, in a setback, the Federal Reserve said Citi, unlike most of its peers, did not have enough capital to raise its div & still withstand a financial crisis worse than 2008.  On these mixed kind of earnings, the stock rose 76¢.

Citigroup Shares Advance as Bank’s Bond-Trading Revenue More Than Doubles

Citigroup Inc. (C)


stock chart


Last week was weak & this week began in a sluggish fashion.  Bank earnings are coming in wishy-washy.  Gains from reversing provisions for bad debts are only temporary.  The rest of the story is inconclusive.  AAPL is down a whopping 50 from its highs set a week ago, not a positive sign for the markets.  The European debt mess is flaring up again & slower growth for China are nagging worries which are keeping buyers away.  This week should bring more earnings reports, but expectations are not high.  Markets are on defense.

Dow Industrials


stock chart


Get your favorite symbols' Trend Analysis TODAY!  

Monday, March 19, 2012

Apple's rise to a new record high leads markets higher

Dow began lower & rose into the black where it remained.  It finished up 6, advancers over decliners almost 2-1 & NAZ jumped 23 (propelled by a 15 advance to 601 for Apple).  Bank stocks settled back a bit, taking Financial Index up only 1+ to the 213s (off 2 from its highs).

The MLP index gained 4 to 401 & the REIT index was up 2 to the 253s, matching its yearly highs (far below the record high of 350 in 2007).  Junk bond funds pulled back & Treasuries sank again, driving the yield on the 10 year Treasury bond up to nearly 3.4%.  Oil had another good day, heading back to $110 & gold was up modestly.

JPMorgan Chase Capital XVI (AMJ)


stock chart


Click below for the latest market update below:


Treasury yields:


U.S. 3-month

0.081%

U.S. 2-year

0.379%

U.S. 10-year

2.377%

CLJ12.NYM...Crude Oil Apr 12108.04 ...Up 0.98  (0.9%)

Live 24 hours gold chart [Kitco Inc.]


  • <p>               This March 16, 2012, shows a sign for new homes for sale in Doral, Fla. Homebuilders' feelings about the current housing market haven't changed from February. But many are growing more optimistic that sales could pick up in the coming months. (AP Photo/Alan Diaz)
Photo:    Yahoo

Homebuilders' feelings about the current housing market haven't changed from Feb, but many are growing more optimistic that sales could pick up in the coming months.  The National Association of Home Builders/Wells Fargo said that its builder sentiment index stayed at 28, the highest level since Jun 2007 (followed 5 straight increases).  Builders expressed more confidence in sales over the next 6 months.  A separate gauge, measuring that outlook, rose in Mar for the 6th straight month, from 34 to 36.  However, the industry has a long way to go.  Any reading below 50 indicates negative sentiment about the housing market & the index hasn't reached 50 for 6 years.  A key reason homebuilders are more optimistic is that they have seen more people express interest in buying a home.  Growing interest has occurred alongside other improvements that suggest the market could pick up after 4 weak years.  Sales of previously occupied homes rose in Jan to its highest level since May 2010.  Mortgage rates have never been lower & home construction has picked up.  But prices continue to fall.  Builders keep slashing prices to stay competitive.  Last year was the worst for new-home sales on records dating back to 1963.  Builders are struggling to compete with foreclosures, which have forced down prices of previously occupied homes.  In addition, many are finding it hard to qualify for loans or meet higher required down payments.  Low appraisals are scuttling some deals after contracts have been signed.  As a result, some people who want to buy a new house are holding off because they can't sell their home.  The recent rise in yields for Treasuries will increase mortgage rates linked to the 10 year Treasury.  Overall, limited good news for housing.

Homebuilder Confidence in U.S. Holds at Highest Since 2007


UPS to Buy TNT Express for $6.8 Billion

Photo:    Bloomberg

United Parcel Service will buy Dutch peer TNT Express for €5.2B ($6.85B) to boost its position as the world's largest package delivery company outside the US.  It will become the market leader in Europe & also gain access to TNT's stronger networks in the fast-growing Asian & Latin American markets, increasing the company's global revenue to more than $60B from $53B in 2011 & leaving it with 477K employees.  "TNT Express fits into UPS's long-term network plan," UPS CEO Davis said.  "This broadens UPS's global footprint."  The deal will expand UPS revenue outside the US to 36% of its total, from 26% today, & increase its presence in Brazil & Australia.  The acquisition is the largest by far in the 104-year history of UPS & sharply widens the gap between UPS and #2 FedEx (FDX).  The stock rose 2.72 to 81.13.

UPS to Purchase TNT Express for $6.8 Billion

United Parcel Service, Inc. (UPS)


stock chart


Gas prices keep climbing, now just a dime below the highpoint last year.

12onth Average
State's Graph
Source:   AAA


This was a another day with reasonably good news, but markets did not respond in a meaningful way.  The Apple div news comes in first place although not a complete surprise after so many have been asking about it.  The UPS acquisition was significant & housing news was encouraging.  Maybe buyers took long weekends to spend some of their profits.  Dow spent most of the day in the black but lost much of those gains in the last hour.  Dow is up 1K in Q1 & has doubled off its lows 3 years ago (with only minimal setbacks along the way).  That's quite a run!

Dow Industrials


stock chart


Get your favorite symbols' Trend Analysis TODAY! Click Here