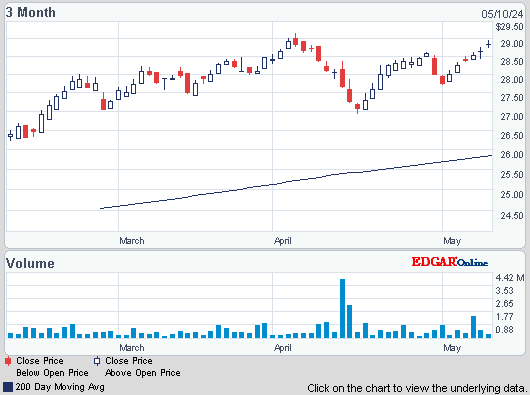
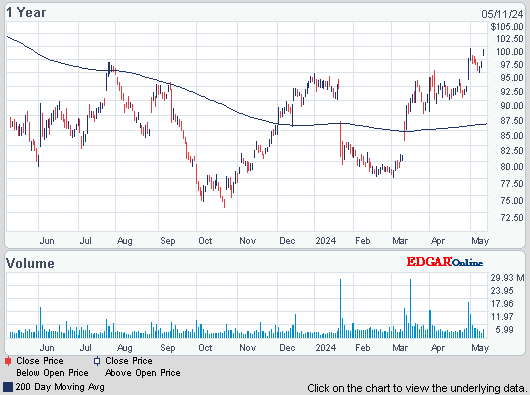
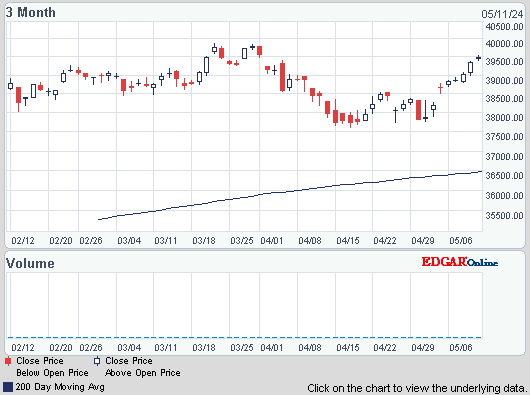
Dow rose 83, advancers ahead of decliners 2-1 & NAZ dropped 5, hurt by a plunge at Apple (AAPL). The Financial Index added 1+ to 235. The MLP index was flat at 423 & the REIT index was up a fraction in the 279s. Junk bond funds were a little lower & Treasuries saw selling. Oil is back too $96 & wants to go $100. There are confusing quotes for gold, but the current one shows it down $14 to 1672. Believe that one.
AMJ (Alerian MLP Index tracking fund)


Photo: Bloomberg
The number seeking unemployment fell last week to the lowest level in 5 years. The Labor Dept said that weekly unemployment applications dropped 5K to 330K, the fewest since Jan 2008. The 4-week average fell to 351K, also the lowest in nearly 5 years. However the decline may reflect the gov's difficulty adjusting its numbers to account for layoffs after the holiday shopping season. Layoffs spike in the 2nd week of Jan & then plummeted. If the trend holds up, fewer applications would suggest the job market is improving. Applications have fluctuated between 360K - 390K for most of last year. At the same time, employers added an average of 153K jobs a month. That's just been enough to slowly push down the unemployment rate. The number continuing to claim benefits is also falling. There were nearly 5.7M receiving unemployment aid in the last week, down from almost 5.9M in the previous week.
Jobless Claims in U.S. Decrease, Prolonging Seasonal Swings

Photo: Bloomberg
The index of US leading indicators rose in Dec by the most in 3 months. The Conference Board’s gauge of the outlook for the next 3-6 months increased 0.5% after the Nov reading was revised to unchanged from a previously reported decline. The projection was for the gauge to rise 0.4%. The recovery in residential real estate, sustained job growth & stock-market gains that are extending through this month are giving Americans the wherewithal to spend. At the same time, higher payroll taxes & possible budget cutbacks threaten to limit how fast the expansion can advance.
Index of Leading Economic Indicators in U.S. Increases 0.5%
3M, a Dow stock & Dividend Aristocrat, EPS in Q4 increased to $1.41 from $1.35 in the prior year. The results met the average estimate. Revenue rose 4.2% to $7.39B from $7.09B, ahead of the $7.18B estimate. Some of the strongest growth was in China, where sales were up 16%, sharply outpacing a 5.2% rise in the US & a 0.6% decline in Western Europe, where economies "have stabilized but are not yet growing," CFO David Meline said. MMM began to unveil steps CEO Inge Thulin is making to improve profitability at underperforming units. Thulin, said last year that he had identified a handful of units that it would need to fix, sell or close. The maker of Post-It notes & films used in TV screens is merging its security & traffic-safety units, a shift that

Stocks continue on their winning ways with mediocre earnings which are good enough to beat "the estimates." Then AAPL reported last night. The report was good, but not good enough to satisfy optimistic forecasts. The stock, down a massive $53 & sinking, is a big drag on NAZ & the S&P 500 where it has a major influence. This is another reminder that all is not well with the economic recovery. But Dow is at a 5+ year high as if it didn't have a care in the world.
Dow Jones Industrials

AMJ (Alerian MLP Index tracking fund)
Treasury yields:
U.S. 3-month |
0.079% | |
U.S. 2-year |
0.245% | |
U.S. 10-year |
1.853% |
| CLH13.NYM | ..Crude Oil Mar 13 | ...95.95 | .... | (0.8%) |

Photo: Bloomberg
The number seeking unemployment fell last week to the lowest level in 5 years. The Labor Dept said that weekly unemployment applications dropped 5K to 330K, the fewest since Jan 2008. The 4-week average fell to 351K, also the lowest in nearly 5 years. However the decline may reflect the gov's difficulty adjusting its numbers to account for layoffs after the holiday shopping season. Layoffs spike in the 2nd week of Jan & then plummeted. If the trend holds up, fewer applications would suggest the job market is improving. Applications have fluctuated between 360K - 390K for most of last year. At the same time, employers added an average of 153K jobs a month. That's just been enough to slowly push down the unemployment rate. The number continuing to claim benefits is also falling. There were nearly 5.7M receiving unemployment aid in the last week, down from almost 5.9M in the previous week.
Jobless Claims in U.S. Decrease, Prolonging Seasonal Swings

Photo: Bloomberg
The index of US leading indicators rose in Dec by the most in 3 months. The Conference Board’s gauge of the outlook for the next 3-6 months increased 0.5% after the Nov reading was revised to unchanged from a previously reported decline. The projection was for the gauge to rise 0.4%. The recovery in residential real estate, sustained job growth & stock-market gains that are extending through this month are giving Americans the wherewithal to spend. At the same time, higher payroll taxes & possible budget cutbacks threaten to limit how fast the expansion can advance.
Index of Leading Economic Indicators in U.S. Increases 0.5%
3M, a Dow stock & Dividend Aristocrat, EPS in Q4 increased to $1.41 from $1.35 in the prior year. The results met the average estimate. Revenue rose 4.2% to $7.39B from $7.09B, ahead of the $7.18B estimate. Some of the strongest growth was in China, where sales were up 16%, sharply outpacing a 5.2% rise in the US & a 0.6% decline in Western Europe, where economies "have stabilized but are not yet growing," CFO David Meline said. MMM began to unveil steps CEO Inge Thulin is making to improve profitability at underperforming units. Thulin, said last year that he had identified a handful of units that it would need to fix, sell or close. The maker of Post-It notes & films used in TV screens is merging its security & traffic-safety units, a shift that
Stocks continue on their winning ways with mediocre earnings which are good enough to beat "the estimates." Then AAPL reported last night. The report was good, but not good enough to satisfy optimistic forecasts. The stock, down a massive $53 & sinking, is a big drag on NAZ & the S&P 500 where it has a major influence. This is another reminder that all is not well with the economic recovery. But Dow is at a 5+ year high as if it didn't have a care in the world.
Dow Jones Industrials


No comments:
Post a Comment