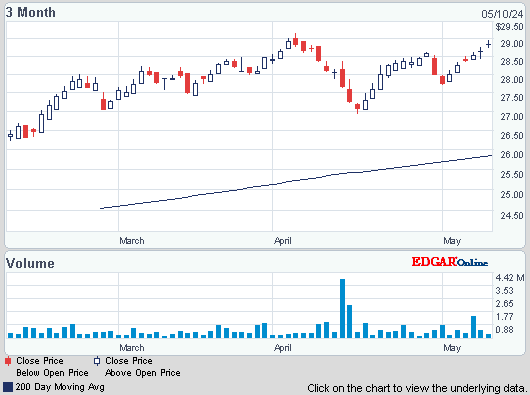
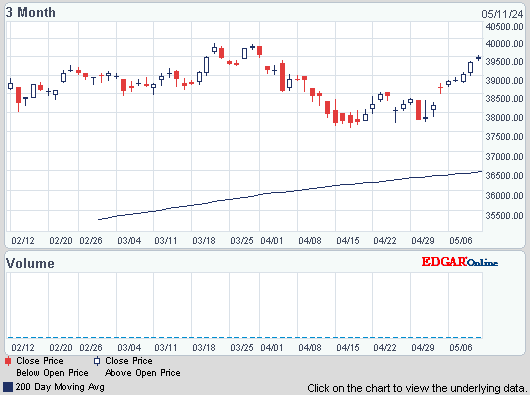
Dow rose 42, advancers over decliners 3-2 & NAZ was up 3. The Financial Index was up a fraction to the 198s, essentially matching its highs since early May. The MLP index slipped a fraction to 394 & the REIT index rose 1 to 268 (2 below the yearly high). Junk bond funds were higher & Treasuries declined ahead of the FOMC announcement. Oil rose on speculation central banks will take steps to support the economic recovery & after US crude inventories dropped the most in almost 5 years. Gold dropped back below 1600.


Photo: Bloomberg
US companies added more workers than projected in Jul, indicating the job market was holding up entering as it enters H2 The 163K increase followed a revised 172K gain in the prior month according to ADP Employer Services. The forecast called for an advance of 120K. A pickup in hiring is needed to generate the wage gains that would spur consumer spending. The Labor Dept report on Fri may show private payrolls rose by 110K (it was over 200K in Q1) & unemployment held at 8.2%. Since Apr 2010, ADP’s initial estimate has either overstated or understated the Labor Dept’s initial reading on private payrolls by 72K on average.

Photo: Bloomberg
Manufacturing in the US shrank for the 2nd straight month in Jul, further evidence of an economy growing at a sluggish pace. The Institute for Supply Management said that its index of manufacturing activity ticked up to 49.8, from 49.7 in June. A reading below 50 indicates contraction & Jun was the first time the survey showed manufacturing contracted in 3 years. While factories have been a key source of jobs & growth since the recession ended in Jun 2009, the sector has shown signs of weakness in recent months. The report points toward more slow growth, rather than another recession. The index needs to fall below 43 to signal a recession is likely. An uncertain economic outlook has made consumers & businesses reluctant to spend, lowering demand for factory goods. Factories kept hiring in Jul but at a slower pace & new orders declined more slowly than in Jun. Overall, manufacturing output rose at only a 1.4% annual rate in Q2, after a jump of 9.8% in Q1.
Manufacturing in U.S. Unexpectedly Contracts for Second Month

Photo: Bloomberg
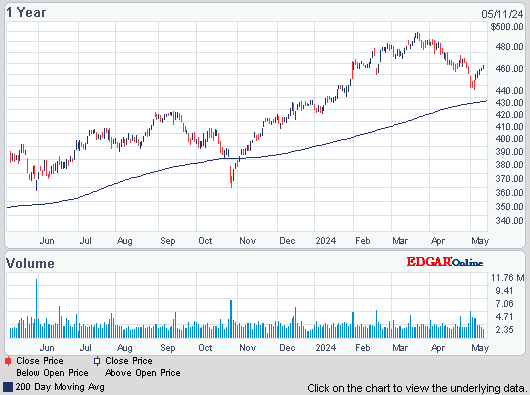
MasterCard reported a 15% increase Q2 income after recording a $13M expense related to a settlement with merchants over credit card fees. EPS rose to $5.55, up from $4.76 a year ago. Excluding the charge, EPS was $5.65, above the $5.57 forecast. Purchase volume, the amount people spent on debit & credit cards with MasterCard logos, rose 13% worldwide, slower than the 17% recorded in Q1, reflecting a slowdown in many economies around the world. Results were also tempered by the strength of the dollar. A strong dollar reduced the value of earnings made overseas when that money is converted back into dollars. MA increased rebates & incentives to both new customers & those that were renewing agreements. These kinds of incentives are common practice in the credit card industry, but there are concerns that they can weaken future results. The stock fell $9.19.
MasterCard Declines as Second-Quarter Revenue Misses Analysts’ Estimates

Markets are awaiting developments later today when the Federal Reserve makes its statement after the meeting. Little new is expected. Tomorrow the ECB will speak & everybody is guessing what will come from that. Fri is the big jobs report & the Jul number for new jobs will probably be drab (mentioned above). Other economic data continues to be weak. Meanwhile, the bulls have the upper hand in the markets & Dow continues to hang in above 13K.

AMJ (Alerian MLP Index tracking fund)
Treasury yields:
U.S. 3-month | 0.091% | |
U.S. 2-year | 0.211% | |
U.S. 10-year | 1.509% |
| CLU12.NYM | ...Crude Oil Sep 12 | ...88.45 | .... | (0.4%) |
| GCQ12.CMX | ...Gold Aug 12 | .....1,598.40 | ... | (0.8%) |
Get the latest daily update below:

US companies added more workers than projected in Jul, indicating the job market was holding up entering as it enters H2 The 163K increase followed a revised 172K gain in the prior month according to ADP Employer Services. The forecast called for an advance of 120K. A pickup in hiring is needed to generate the wage gains that would spur consumer spending. The Labor Dept report on Fri may show private payrolls rose by 110K (it was over 200K in Q1) & unemployment held at 8.2%. Since Apr 2010, ADP’s initial estimate has either overstated or understated the Labor Dept’s initial reading on private payrolls by 72K on average.

Manufacturing in the US shrank for the 2nd straight month in Jul, further evidence of an economy growing at a sluggish pace. The Institute for Supply Management said that its index of manufacturing activity ticked up to 49.8, from 49.7 in June. A reading below 50 indicates contraction & Jun was the first time the survey showed manufacturing contracted in 3 years. While factories have been a key source of jobs & growth since the recession ended in Jun 2009, the sector has shown signs of weakness in recent months. The report points toward more slow growth, rather than another recession. The index needs to fall below 43 to signal a recession is likely. An uncertain economic outlook has made consumers & businesses reluctant to spend, lowering demand for factory goods. Factories kept hiring in Jul but at a slower pace & new orders declined more slowly than in Jun. Overall, manufacturing output rose at only a 1.4% annual rate in Q2, after a jump of 9.8% in Q1.
Manufacturing in U.S. Unexpectedly Contracts for Second Month

MasterCard reported a 15% increase Q2 income after recording a $13M expense related to a settlement with merchants over credit card fees. EPS rose to $5.55, up from $4.76 a year ago. Excluding the charge, EPS was $5.65, above the $5.57 forecast. Purchase volume, the amount people spent on debit & credit cards with MasterCard logos, rose 13% worldwide, slower than the 17% recorded in Q1, reflecting a slowdown in many economies around the world. Results were also tempered by the strength of the dollar. A strong dollar reduced the value of earnings made overseas when that money is converted back into dollars. MA increased rebates & incentives to both new customers & those that were renewing agreements. These kinds of incentives are common practice in the credit card industry, but there are concerns that they can weaken future results. The stock fell $9.19.
MasterCard Declines as Second-Quarter Revenue Misses Analysts’ Estimates
MasterCard (MA)
Markets are awaiting developments later today when the Federal Reserve makes its statement after the meeting. Little new is expected. Tomorrow the ECB will speak & everybody is guessing what will come from that. Fri is the big jobs report & the Jul number for new jobs will probably be drab (mentioned above). Other economic data continues to be weak. Meanwhile, the bulls have the upper hand in the markets & Dow continues to hang in above 13K.
Dow Jones Industrials
Get your favorite symbols' Trend Analysis TODAY!


No comments:
Post a Comment