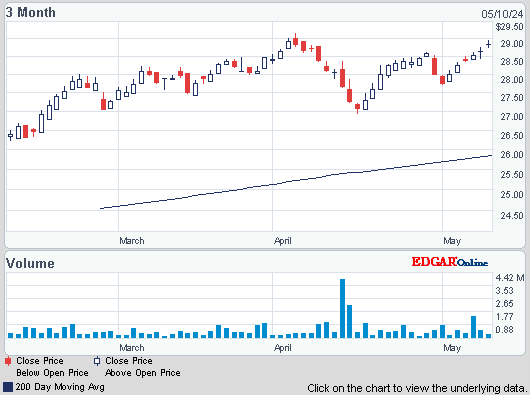
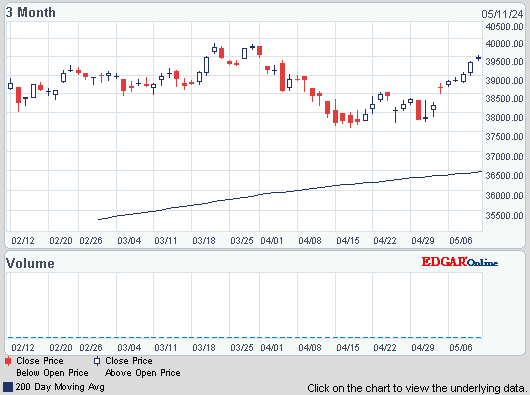
Dow was up 14, advancers over decliners 3-2 & NAZ was up 9. The Financial Index inched up a fraction in the 201s, a 3 month high. The MLP index rose 1+ to the 389s & the REIT index was flat in the 262s. Junk bond funds edged higher but Treasuries sold off, bringing the yield on the 10 year Treasury over 1.7% (up 30 basis points from record lows in just 2 weeks). Oil rose as reports showed fewer Americans filed applications for unemployment & the US trade deficit declined, signaling economic growth may increase. Oil continued trading sideways, above 1600.

Photo: Yahoo
The number applying for unemployment benefits fell 6K last week to 361K, a level consistent with modest gains in hiring. The Labor Dept said that the 4-week average rose by 2K to 368K. Weekly applications bounce around in Jul, skewed by the difficulty of accounting for temporary summertime layoffs in the auto industry but the seasonal distortions had faded by last week. When they consistently fall below 375,000, it typically suggests hiring is strong enough to lower the unemployment rate. By way of comparison, claims averaged 328K in Nov 2004, 3 years after the 2001 recession. The total number receiving some kind of benefits also fell. Nearly 5.8M received aid, 200K less than a week earlier. Despite the improvement in hiring in Jul, the unemployment rate ticked up to 8.3% in Jun.
U.S. Jobless Claims Unexpectedly Fall as Labor Market Mends

Photo: Bloomberg
Chinese data showed price pressures were abating as a weakening economy affected growth in industrial production & consumption, strengthening calls for a further loosening its monetary policy. Aided by falling food prices, the consumer-price index rose 1.8% in Jul from the year-ago period, the lowest point since Jan 2010 & down from the 2.2% increase in Jun. The monthly producer-price index dropped 2.9%, accelerating from a 2.1% deflation recorded in Jun according to the National Bureau of Statistics. Forecasts expected the CPI to rise 1.7% & the PPI to drop 2.5%. Easing measures for the economy are expected.
Photo: Yahoo
The US trade deficit fell to its lowest level in 18 months in Jun, pushed down by a steep drop in oil imports & a rise in exports. The trade gap narrowed to $42.9B, down from $48B in May according to the Commerce Dept. Exports rose 0.9% to a record high of $185B. Overseas sales of autos, pharmaceuticals, & industrial machinery increased. Despite Europe's struggling economy, exports to the 27-nation EU increased 1.7%. Imports fell 1.5% to $227.9B, the lowest in 4 months. A key reason was the average price of imported oil fell $7.78 to $100.13, the biggest drop in 3½ years. That brought the trade deficit in oil to its lowest level since Nov 2010 & accounted for half of the improvement in the overall trade gap. Excluding oil, the trade deficit dropped to $20.4B from $23.2B in May. Imports of computer equipment & TVs also declined. A narrower trade gap acts as less of a drag on growth because it means the US is spending less on foreign-made products & is taking in more from sales of US made goods. The sharp drop in the deficit could mean the economy actually grew at a faster pace in Q2 than first estimated, a 1.5% annual rate. The trade deficit with China worsened, rising 5.2% to $27.4B. US sales to China fell, possibly because that country's growth is slowing. Exports to China dropped 4.3% to $8.5B.
Trade Deficit in the U.S. Shrank More Than Forecast in June
Markets are back to marking time. The jobless data was favorable, but modest improvement is considered routine. China has to decide what needs to be done to improve its rate of growth. Once again, there was a lack of dreary news from Europe. While beneficial, hardly a sign of improvement in solving fundamental economic problems. Dow continues to bump along, just under its important 13.4K ceiling.

AMJ (Alerian MLP Index tracking fund)
Treasury yields:
U.S. 3-month | 0.106% | |
U.S. 2-year | 0.280% | |
U.S. 10-year | 1.714% |
| CLU12.NYM | ...Crude Oil Sep 12 | ...93.60 | ... | (0.3%) |
| GCU12.CMX | ...Gold Sep 12 | .....1,614.00 | ... | (0.1%) |
Get the latest daily market update below:
Photo: Yahoo
The number applying for unemployment benefits fell 6K last week to 361K, a level consistent with modest gains in hiring. The Labor Dept said that the 4-week average rose by 2K to 368K. Weekly applications bounce around in Jul, skewed by the difficulty of accounting for temporary summertime layoffs in the auto industry but the seasonal distortions had faded by last week. When they consistently fall below 375,000, it typically suggests hiring is strong enough to lower the unemployment rate. By way of comparison, claims averaged 328K in Nov 2004, 3 years after the 2001 recession. The total number receiving some kind of benefits also fell. Nearly 5.8M received aid, 200K less than a week earlier. Despite the improvement in hiring in Jul, the unemployment rate ticked up to 8.3% in Jun.
U.S. Jobless Claims Unexpectedly Fall as Labor Market Mends

Chinese data showed price pressures were abating as a weakening economy affected growth in industrial production & consumption, strengthening calls for a further loosening its monetary policy. Aided by falling food prices, the consumer-price index rose 1.8% in Jul from the year-ago period, the lowest point since Jan 2010 & down from the 2.2% increase in Jun. The monthly producer-price index dropped 2.9%, accelerating from a 2.1% deflation recorded in Jun according to the National Bureau of Statistics. Forecasts expected the CPI to rise 1.7% & the PPI to drop 2.5%. Easing measures for the economy are expected.
Photo: Yahoo
The US trade deficit fell to its lowest level in 18 months in Jun, pushed down by a steep drop in oil imports & a rise in exports. The trade gap narrowed to $42.9B, down from $48B in May according to the Commerce Dept. Exports rose 0.9% to a record high of $185B. Overseas sales of autos, pharmaceuticals, & industrial machinery increased. Despite Europe's struggling economy, exports to the 27-nation EU increased 1.7%. Imports fell 1.5% to $227.9B, the lowest in 4 months. A key reason was the average price of imported oil fell $7.78 to $100.13, the biggest drop in 3½ years. That brought the trade deficit in oil to its lowest level since Nov 2010 & accounted for half of the improvement in the overall trade gap. Excluding oil, the trade deficit dropped to $20.4B from $23.2B in May. Imports of computer equipment & TVs also declined. A narrower trade gap acts as less of a drag on growth because it means the US is spending less on foreign-made products & is taking in more from sales of US made goods. The sharp drop in the deficit could mean the economy actually grew at a faster pace in Q2 than first estimated, a 1.5% annual rate. The trade deficit with China worsened, rising 5.2% to $27.4B. US sales to China fell, possibly because that country's growth is slowing. Exports to China dropped 4.3% to $8.5B.
Trade Deficit in the U.S. Shrank More Than Forecast in June
Markets are back to marking time. The jobless data was favorable, but modest improvement is considered routine. China has to decide what needs to be done to improve its rate of growth. Once again, there was a lack of dreary news from Europe. While beneficial, hardly a sign of improvement in solving fundamental economic problems. Dow continues to bump along, just under its important 13.4K ceiling.
Dow Jones Industrials
Get your favorite symbols' Trend Analysis TODAY!


1 comment:
The Payment Protection Insurance usually comes in handy when an unpredictable accident, a critical illness, and unemployment befalls on the borrower disabling him to pay for the monthly amortizations of his debts.
PPI claims
Post a Comment