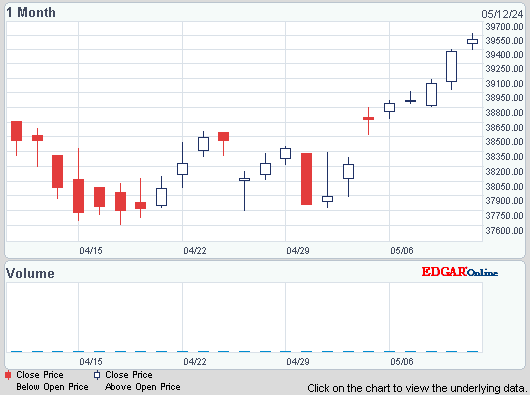
Dow rose 21, advancers slightly ahead of decliners & NAZ was off a fraction. The Financial Index fell a fraction in the 209s. The MLP index slipped a fraction to the 389s & the REIT index was off a fraction in the 256s. Junk bond funds were mixed to higher & Treasuries slid back, taking the yield on the 10 year Treasury up to 1.68%. Oil maintained gains
after the US gov reported inventories declined last
week. Gold gained for the 2nd time in 3 days as central banks increased holdings & rising
MidEast tensions boosted demand for an investment haven.


Photo: Bloomberg
There were fewer applications for unemployment benefits last week as damage to the labor market caused by superstorm Sandy began to subside. Jobless claims decreased 41K to 410K according to the Labor Dep, matching the forecast. The level of claims reflects the economic drag associated with Sandy. Before the storm- related surge in unemployment applications, companies limited hiring in the wake of a global economic slowdown & uncertain U.S. fiscal outlook. The 4-week average, rose to 396K from 387K. The number continuing to receive jobless decreased decreased 30K to 3.34M. The continuing claims figure doesn’t include Americans receiving extended benefits under federal programs. Those who have exhausted their traditional benefits & are collecting emergency & extended payments rose 62K to 2.19M.
Photo: Yahoo
Consumer sentiment stalled at the end of Nov as uncertainty grew over federal tax & spending programs next year. The Thomson Reuters/University of Michigan's final reading on the overall index on consumer sentiment came in at 82.7, a touch up from 82.6 the month before, but down from a preliminary reading of 84.9 released earlier in the month & was below the forecast of 84.5. "The late-month retreat was accompanied by more economic uncertainty about future federal taxes and spending programs and the inability of the political parties to reach a settlement," survey director Richard Curtin said. The survey's barometer of current economic conditions rose to 90.7 from an Oct final reading of 88.1 & compares with a forecast of 90.6. The gauge of consumer expectations slipped to 77.6 from 79.0 in Oct & was lower than the forecast of 80.1. The survey's one-year inflation expectations were steady at 3.1%, while the survey's 5-10-year inflation outlook was at 2.8% from 2.7%.
U.S. Michigan Consumer Sentiment Index Rose to 82.7 in November

Photo: Bloomberg
A measure of the US economy intended to signal future activity rose only slightly last month, suggesting growth could stay weak. The Conference Board leading indicators index increased 0.2% in Oct after a 0.5% gain in Sep. The index is intended to anticipate economic conditions 3-6 months out. The strength in Oct came from lower interest rates, a drop in applications for unemployment benefit & an increase in demand for large manufactured goods. Some businesses are pulling back on concern that hurtling over the fiscal cliff will damage the economy.
U.S. Leading Economic Indicators Rose 0.2% in OctoberU.S. Leading Economic Indicators Rose 0.2% in October
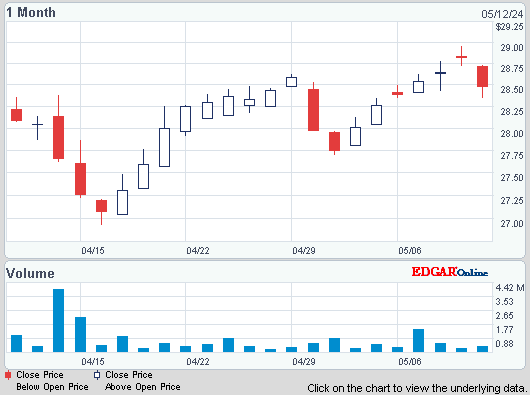
There is very little going on with many traders taking an early holiday. The news remains bland. Greece is still begging for more money but those with the money are hesitating. The US economy is far less than robust as talks about resolving the fiscal cliff are going nowhere. Dow & MLPs (shown above) have had a very volatile time in the last 2 weeks, but the markets are settling down, a least for the time being.

AMJ (Alerian MLP Index tracking fund)
| CLF13.NYM | ....Crude Oil Jan 13 | ...87.26 | ... | (0.6%) |
| GCX12.CMX | ...Gold Nov 12 | ....1,725.80 | ... | (0.2%) |

Photo: Bloomberg
There were fewer applications for unemployment benefits last week as damage to the labor market caused by superstorm Sandy began to subside. Jobless claims decreased 41K to 410K according to the Labor Dep, matching the forecast. The level of claims reflects the economic drag associated with Sandy. Before the storm- related surge in unemployment applications, companies limited hiring in the wake of a global economic slowdown & uncertain U.S. fiscal outlook. The 4-week average, rose to 396K from 387K. The number continuing to receive jobless decreased decreased 30K to 3.34M. The continuing claims figure doesn’t include Americans receiving extended benefits under federal programs. Those who have exhausted their traditional benefits & are collecting emergency & extended payments rose 62K to 2.19M.
Photo: Yahoo
Consumer sentiment stalled at the end of Nov as uncertainty grew over federal tax & spending programs next year. The Thomson Reuters/University of Michigan's final reading on the overall index on consumer sentiment came in at 82.7, a touch up from 82.6 the month before, but down from a preliminary reading of 84.9 released earlier in the month & was below the forecast of 84.5. "The late-month retreat was accompanied by more economic uncertainty about future federal taxes and spending programs and the inability of the political parties to reach a settlement," survey director Richard Curtin said. The survey's barometer of current economic conditions rose to 90.7 from an Oct final reading of 88.1 & compares with a forecast of 90.6. The gauge of consumer expectations slipped to 77.6 from 79.0 in Oct & was lower than the forecast of 80.1. The survey's one-year inflation expectations were steady at 3.1%, while the survey's 5-10-year inflation outlook was at 2.8% from 2.7%.
U.S. Michigan Consumer Sentiment Index Rose to 82.7 in November

Photo: Bloomberg
A measure of the US economy intended to signal future activity rose only slightly last month, suggesting growth could stay weak. The Conference Board leading indicators index increased 0.2% in Oct after a 0.5% gain in Sep. The index is intended to anticipate economic conditions 3-6 months out. The strength in Oct came from lower interest rates, a drop in applications for unemployment benefit & an increase in demand for large manufactured goods. Some businesses are pulling back on concern that hurtling over the fiscal cliff will damage the economy.
U.S. Leading Economic Indicators Rose 0.2% in OctoberU.S. Leading Economic Indicators Rose 0.2% in October
There is very little going on with many traders taking an early holiday. The news remains bland. Greece is still begging for more money but those with the money are hesitating. The US economy is far less than robust as talks about resolving the fiscal cliff are going nowhere. Dow & MLPs (shown above) have had a very volatile time in the last 2 weeks, but the markets are settling down, a least for the time being.


No comments:
Post a Comment