Friday, December 30, 2011

Markets finish a drab year lower

Dow lost 69 (with light selling into the close), advancers slightly head of decliners & NAZ fell 9.  The Financial Index was down 1 to 175 after a substantial decline this year..

The Alerian MLP Index finished the year just under the 390 highs set 8 months ago, quite an accomplishment in an otherwise dismal year.  The Dow Jones REIT index gained 8 or 4%, not bad when dividends are considered a bonus.  Junk bond funds gained around 5%, again a decent showing when combined with yields of 8-10%.  Oil was about even, falling short of closing above the magic $100 level.   Gold had a rough period in the last 4 months, but still managed a 10% gain which extended its winning streak to 11 years (when most stocks have only been marking time).

ALERIAN MLP Index


DJ REIT INDEXDJR


Click below for the latest market update:


Treasury yields:


U.S. 3-month

0.010%

U.S. 2-year

0.239%

U.S. 10-year

1.876%

CLG12.NYM...Crude Oil Feb 12...98.95...Down 0.70  (0.7%)

Live 24 hours gold chart [Kitco Inc.]


The year was supposed to see an extension of the 2 year rally, one of the greatest in history.  But it wasn't.  European debt issues were the biggest drag along with chaos in DC about solving the country's deficit problems.  After losing their elite credit rating, Treasuries still had one of their best years ever.  The yield on the 10 year Treasury bond dropped 150 basis points to close at 1.87%, near its record lows reach in Oct.  This was a winner year for yield securities.

Next year is very touchy at best.  The European debt issues are not going away time soon.  The US has to deal with its massive borrowings, which are still growing at over $4B every single day.  The end of Feb is close & that's when hard decisions have to made about extending tax cuts & unemployment benefits with both sides digging in their heals.  In 2012, high yield securities may end up being the biggest winners again.

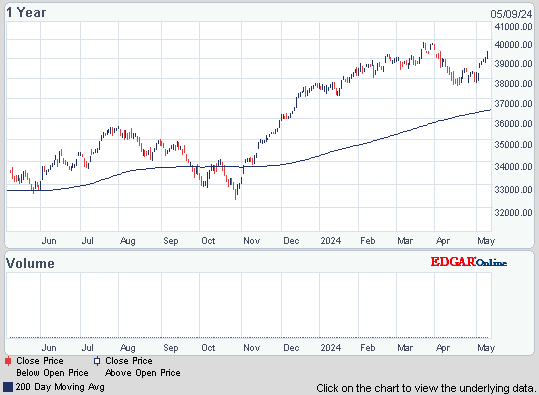
Dow 30

2010   11,577
2011   12,217... up 5.5%

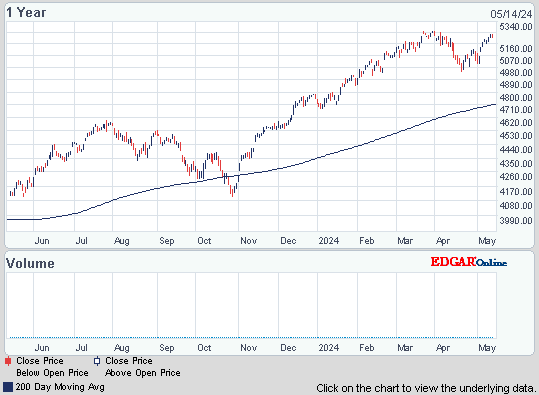
S&P 500

2010   1,257.
2011   1,258... essentially even

Alerian MLP Index

2010     363
2011     389... up 7% & just below the 390 record    
Dow Industrials


stock chart

S&P 500


stock chart


Get your favorite symbols' Trend Analysis TODAY!!  


Mixed markets of the last day of trading

Dow fell 22, advancers over decliners 3-2 & NAZ slipped a fraction on very light year end volume.  Bank stocks were lower & the Financial Index is down about 40 in 2011.

S&P 500 Financials Sector Index


Value 175.65 One-Year Chart for S&P 500 Financials Sector Index GICS Level 1 (S5FINL:IND)
Change    -0.67     (-0.4%)


The MLP index was down fractionally to the 388s, staying close to the 390 record, & the REIT index gained 1+ to the 234s.  Junk bond funds are mixed & generally up modestly in 2011.  Treasuries gained for a 4th day, poised for the biggest annual return since 2008, as investors sought the relative safety of US gov bonds on concern Europe’s sovereign-debt crisis will worsen.  Oil inched up towards $100 as the US economy improves.  Gold rebounded after having a bad 4 months.

Gold Rebounds

Photo:   Bloomberg

Gold rose for the first time in more than a week, leading a rally in precious metals, on speculation that the lowest prices in five months will spur demand from jewelers and investors.

ALERIAN MLP Index


DJ REIT INDEXDJR


Treasury yields:

U.S. 3-month

0.010%

U.S. 2-year

0.255%

U.S. 10-year

1.868%

CLG12.NYM...Crude Oil Feb 12..99.41 ....Down 0.24  (0.2%)

GCF12.CMX...Gold Jan 12.....1,570.90 ...Up 31.00  (2.0%)

Get the latest market update below:


Growth in U.S. May Accelerate Even as Europe Shrinks

Photo:   Bloomberg

Rising confidence, fewer layoffs & gains in holiday sales show the US economy is picking up, defying a slowdown in Europe & much of the rest of the world.  The divergence could become even starker in 2012 as the world’s largest economy accelerates, the 17-member euro area sinks into a recession & growth in emerging markets cools.  An improving job market & freer credit may underpin American household sentiment & spending just as the debt crisis in Europe prompts additional belt-tightening overseas.  Stabilization in housing will erase a source of weakness at the same time vehicle replacement demand benefits companies like the automakers.  Of course the goings on in DC can be a negative.  An extension of the payroll tax cuts & emergency unemployment benefits is up for renewal in less than 60 days & the 2 sides are far apart.

Growth in U.S. May Accelerate Even as Europe Shrinks


There is not a lot happening with many away on holiday.  MLPs had a good year while REITs & Junk bonds were about even, allowing investors to collect relatively high income.  The slow pace of trading should be even slower in the PM

Dow Industrials


stock chart


Get your favorite symbols' Trend Analysis TODAY!  

Thursday, December 29, 2011

Markets rise, but on low volume

Stocks began the day higher & never looked back.  Dow gained 135, advancers over decliners almost 4-1 & NAZ rose 23.  The Financial Index was up nearly 3 to the 176s, but remains below its 189 highs reached in late Oct.,

The MLP index vaulted 3½ to the 389s, inches from setting a new record, while the REIT index gained 2 to 233.  Junk bond funds were a little higher & Treasuries also inched higher, bringing lower yields.  Oil rose amid speculation that escalating tension in the Middle East may disrupt supplies.  Gold prices fell for the 6th straight day.  It has fallen almost 5% since Dec 20 & is down 11% this month (but remains up YTD).

ALERIAN MLP Index


DJ REIT INDEXDJR


Click below for the latest market update:


CLG12.NYM...Crude Oil Feb 12...99.64 ...Up 0.28  (0.3%)

Treasury yelds:


U.S. 3-month

0.005%

U.S. 2-year

0.263%

U.S. 10-year

1.901%


Live 24 hours gold chart [Kitco Inc.]


Amazon Falls

Photo:   Bloomberg

Amazon may miss Q4 sales estimates, predicted by Goldman Sachs, citing slower-than-expected e-commerce growth.  Revenue is expected to to rise 38% from a year earlier to $17.9B, less the $18.2B expected.  This projection is based on data from ComScore, which found that total e-commerce sales rose 15% in the Nov-Dec holiday shopping season.  While AMZN historically outpaces the broader market by 23 percentage points, that still doesn’t get the company to the 40% growth forecasted.  Its bottom line also is suffering as the company steps up spending on fulfillment centers & it builds out Web services.  CEO Jeff Bezos said in Oct the company may post a loss in Q4.  Operating margin may narrow to 0.84% in the period, from 3.66% a year earlier.  But another analyst gave a more upbeat view on Q4 sales, saying that AMZN may beat estimates, boosted by sales of its new Kindle Fire tablet.  AMZN said earlier today that it sold “well over” 1M Kindles a week in Dec, thanks to record demand fueled by the Kindle Fire.  Take your pick, but I would bet with the first analyst.  After a choppy year, the stock fell 3 pennies in an up market.

Amazon May Fall Short of Quarterly Sales Estimates, Goldman Sachs Predicts

Amazon.com, Inc. (AMZN)


stock chart


The € fell to a 15-month low against the dollar as Italian bond yields rose after the nation sold less than its maximum target at auction.  The  currency dropped to a decade low versus the ¥ as concern increased that the ECB will inject more cash into the financial system to avoid a credit crunch from the region’s debt crisis.  The ¥ & $ strengthened against most of their major counterparts as demand increased for safer assets.  The € was little changed at $1.29+ after falling to $1.28½, the weakest level since Sep 2010.   The shared currency is the worst performer among 10 developed-nation currencies this year, declining 1.7%.  The € today touched its lowest level since 2002 against the index.  The dollar has advanced 1.6% & the ¥ has gained 4.8%.  The European debt mess will be around well into next year.

Euro Falls to a 15-Month Low Versus Dollar on ECB Moves, Italy’s Auction


Walgreen, a Dividend Aristocrat, expects to lose almost 90% of prescriptions handled by pharmacy benefits manager Express Scripts after it leaves Express Scripts' networks next week.  The break will hurt sales, earnings & cash flow during FY2012, although it did not specify the impact.  But it noted that Express Scripts processed 88M prescriptions filled by WAG in FY2011, about $5.3B of its $72B in total. Based on deals it has made with individual Express Scripts clients, WAG expects about keep about 10M of those prescriptions.  The company filled 26M prescriptions for Express Scripts over the first 4 months of the current fiscal year.  The stock was up 15¢.

Walgreen expects to lose most Express Scripts biz AP

Walgreen Co. (WAG)


stock chart


Markets had another good day with many traders away.  The only exciting event is the Alerian MLP Index getting sooo close to its record highs of 390 seen 8 months ago.  High yields are in demand, but higher prices for these securities bring down their yields.  The index is yielding 5.8%, nearing the record low of 5.37% reached in Jul 2007 at a prior index peak of 342.

Dow Industrials 


stock chart


Get your favorite symbols' Trend Analysis TODAY!  


Higher markets on easing tensions over European debts

Dow was up 83, advancers over decliners almost 4-1 & NAZ rose 12.  Bank stocks found buyers with the Financial Index rising 2 to the 175s.

The MLP index rose 1+ to 387 (3 short of its record) & the REIT index was up 2+ to 233.  Junk bond funds were mixed to higher & Treasuries pulled back after yesterday's rally.  Oil fell for a 2nd day on the growing risks from Europe's debt crisis.  Dec has been a rough month for gold, although it's still up YTD with 11 straight years of gains.

AMZ   Alerian MLP Index


DJR   Dow Jones Equity REIT Index


Treasury yields:


U.S. 3-month

-0.005%

U.S. 2-year

0.271%

U.S. 10-year

1.928%

CLG12.NYM...Crude Oil Feb 12...98.95 ...Down 0.41  (0.4%)

GCF12.CMX...Gold Jan 12...1,532.10 ....Down 30.90  (2.0%)


Get the latest market update below:


Jobless Claims in U.S. Drop to Three-Year Low in Past Month

Photo:   Bloomberg

New claims for unemployment benefits rose more than expected last week but the underlying trend continued to point to improving labor market conditions.  Claims for unemployment benefits increased 15K to 381K, according to the Labor Dept.  The prior week's claims data was revised up to 366K from the previously reported 364K & higher than 375K predicted.  Because of a public holiday on Mon, claims from 7 states had been estimated.  The 4-week moving average fell 5K to 375K, the lowest level in 30 months.  The number still receiving benefits under regular state programs rose 34K to 3.6M.  The number on emergency unemployment benefits fell 15K to 2.93M in the latest week.  7.23M were claiming unemployment benefits, up 79K from the prior week. 

Jobless Claims in U.S. Hit Three-Year Low


  • <p>               In this Dec. 27, 2011 photo, a sale pending sign hangs in front of a single-family home in Brookline, Mass. The number of Americans who signed contracts to buy homes in November rose to the highest level in a year and a half. (AP Photo/Steven Senne)
Photo:   Yahoo

The number of contracts to buy homes in Nov rose to the highest level in a year & a half.  While such a gain could suggest a turnaround for the depressed housing market, a growing number of buyers are canceling contracts at the last minute, making it a less reliable gauge.  The National Association of Realtors said that its index of sales agreements jumped 7.3% last month to a reading of 100.1 (a reading of 100 is considered healthy).  The last time the index was that high was in Apr 2010, one month before a federal home-buying tax credit expired.  Contract signings usually indicate where the housing market is headed but there's a one- to 2-month lag between a signed contract & a completed deal.  Homes are the most affordable they've been in decades.  Long-term mortgage rates are at historic lows & prices in most metro areas have tumbled since late 2006.  Yet this year will likely be the worst year for new-home sales in history.  Sales of previously occupied homes are just barely ahead of 2008's dismal figures, the worst yearly showing since 1997.


Italy auctioned €7B ($9B) of debt, bringing the total raised this week to almost €20B.  This underscores how the ECB is helping the world’s 4th-biggest borrower tap markets. But today’s sale fell short of the €8½B target even as borrowing costs declined from last month.  Italy sold €9B in bills yesterday at about half the rate of the previous sale last month, its first auction since the ECB loaned €489B to banks to ease credit amid the region’s debt crisis.  With an economy sinking into its 4th recession since 2001, the gov expects to raise almost €500B next year.  It has to repay about €53B in Q1 from the region’s total maturing bonds of €157B.  Somewhat mitigating this news is the ECB was said to buy the nation’s debt as part of its efforts to stem the spread of the financial crisis.  The situation remains fluid.

Italy Sells 7 Billion Euros of Bonds as Yields Fall


It's difficult too make much of today's rally on light volume.  There is an upside bias this week as financial managers like higher prices to make year end balance sheets look better, especially after after a drab year like this one.  The European debt mess is still lumbering along, far from being resolved.  On the bright side, MLPs are shooting for a new record, something very few securities can claim.

Dow Industrials


stock chart


Get your favorite symbols' Trend Analysis TODAY!