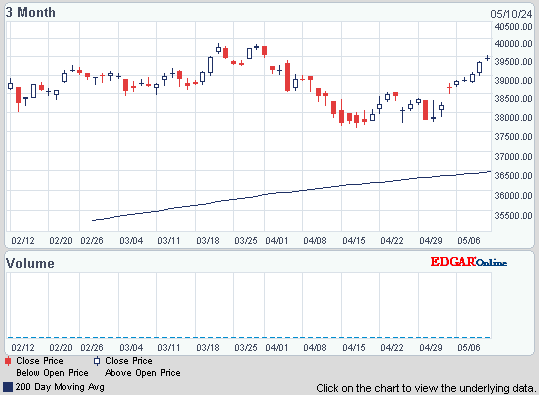
Dow dropped 37, decliners ahead of advancers 3-2 & NAZ was fell 3. The Financial Index was fractionally lower to 187, but still only about 3 away from its highs in late Oct.
The MLP index was off a tad in the 387s & the REIT index fell 2+ to the 232. Junk bond funds were mixed & Treasuries were a little lower. Oil is back at a 7 month high & gold is continuing on its winning ways, casting doubts on the rally by stocks.


Photo: Bloomberg
Consumers pulled back on their spending in Dec despite the holiday shopping season. A Commerce Dept report showed that overall retail sales rose only 0.1% compared to Nov, short of forecasts of a 0.4% rise. Excluding auto sales, which were relatively strong, sales fell 0.2% which compares with forecasts of a 0.3% rise. Part of the reduced spending came from lower prices trimming spending at gas stations by 1.6%. Spending at grocery stores also declined 0.2% amid reports of some lower food prices. There were also declines in some retail categories that typically get a lift from holiday shoppers. The biggest was a 3.9% drop at electronic & appliance stores. Dept store sales fell 0.2%, leading to a 0.8% drop in general merchandise stores. Even non-store retailers, typically online retailers, suffered a 0.4% drop. Bucking the trend were clothing retailers, which enjoyed a 0.7% rise & a 1.6% rise at building material & garden equipment retailers.
Retail Sales in U.S. Rose Less Than Forecast

Unemployment claims jumped 24K to 399K in the first week of 2012, the highest in 6 weeks & up from an upwardly revised 375K in the prior week. The 4 week average marched higher to 381K from 374K. The seasonal-adjustment projected a 12% increase in claims during the first week of Jan. Instead, unadjusted applications climbed by 19%. The unemployment rate has fallen sharply in recent months & was 8.5% Dec, but some worry the drop has been due in part to discouraged workers dropping out of the labor force. The number continuing to receive jobless benefits rose 19K to 3.63M. Those who’ve used up their traditional benefits & are now collecting emergency & extended payments decreased by 48K to 3.45M.
U.S. Jobless Claims Rise More Than Forecast

Photo: Bloomberg
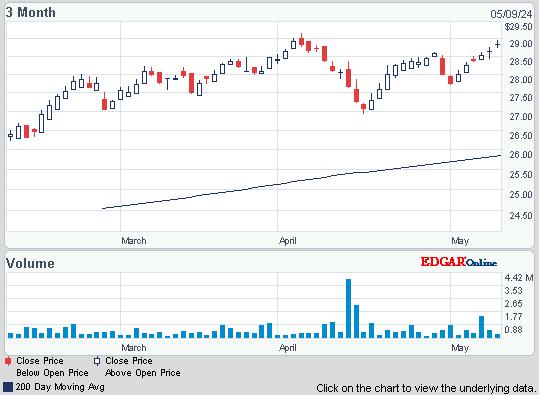
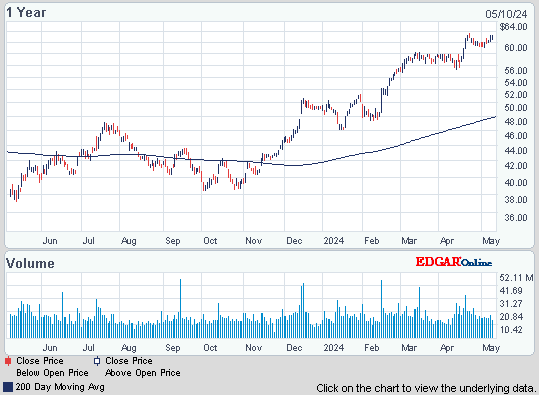
JPMorgan (JPM), a Dow stock, is likely to continue as the most profitable US bank when it reports earnings, but Wells Fargo (WFC) is closing in. JPM is projected to report a record $18.5B in 2011 earnings (when adjusted for one-time items), a 6% increase. Profit at WFC is estimated to have jumped more than 4 times as much, to an all-time high of $15.3B. By focusing on the US & eschewing traditional Wall Street businesses, WFC surpassed earnings at Goldman Sachs (GS) & Citigroup (C). for 6 consecutive qtrs. WFC, with $1.3T in assets is the 4th-largest UB bank, also has higher valuations than its bigger peers. It will be interesting to see how the markets react to earnings releases from the banks.
JPMorgan Set to Post Record 2011 Profit as Wells Fargo Closes Earnings Gap

While not a lot is happening in the markets, the bias switched to negative. Everybody is waiting for earnings reports. The article above indicates bank earnings might be mixed. Earnings should be fairly good, but there will be more to their stories in the details. An indication of more layoffs will also cast a cloud over a healthy image. Concerns about the European debt mess are easing today, but they are subject to wide swings. Dow has not been surging, but is holding well above the 11.2K level & is up YTD, a good sign for the bulls.

The MLP index was off a tad in the 387s & the REIT index fell 2+ to the 232. Junk bond funds were mixed & Treasuries were a little lower. Oil is back at a 7 month high & gold is continuing on its winning ways, casting doubts on the rally by stocks.
JPMorgan Chase Capital XVI (AMJ)
Treasury yields:
U.S. 3-month | 0.015% | |
U.S. 2-year | 0.229% | |
U.S. 10-year | 1.919% |
| CLG12.NYM | ...Crude Oil Feb 12 | ...102.25 | ...... |
| GCF12.CMX | ...Gold Jan 12 | .........1,653.30... | (0.9%) |
Get the latest market update below:
Today's 50 Top Trending Stocks below:

Consumers pulled back on their spending in Dec despite the holiday shopping season. A Commerce Dept report showed that overall retail sales rose only 0.1% compared to Nov, short of forecasts of a 0.4% rise. Excluding auto sales, which were relatively strong, sales fell 0.2% which compares with forecasts of a 0.3% rise. Part of the reduced spending came from lower prices trimming spending at gas stations by 1.6%. Spending at grocery stores also declined 0.2% amid reports of some lower food prices. There were also declines in some retail categories that typically get a lift from holiday shoppers. The biggest was a 3.9% drop at electronic & appliance stores. Dept store sales fell 0.2%, leading to a 0.8% drop in general merchandise stores. Even non-store retailers, typically online retailers, suffered a 0.4% drop. Bucking the trend were clothing retailers, which enjoyed a 0.7% rise & a 1.6% rise at building material & garden equipment retailers.
Retail Sales in U.S. Rose Less Than Forecast

Photo: Bloomberg
Unemployment claims jumped 24K to 399K in the first week of 2012, the highest in 6 weeks & up from an upwardly revised 375K in the prior week. The 4 week average marched higher to 381K from 374K. The seasonal-adjustment projected a 12% increase in claims during the first week of Jan. Instead, unadjusted applications climbed by 19%. The unemployment rate has fallen sharply in recent months & was 8.5% Dec, but some worry the drop has been due in part to discouraged workers dropping out of the labor force. The number continuing to receive jobless benefits rose 19K to 3.63M. Those who’ve used up their traditional benefits & are now collecting emergency & extended payments decreased by 48K to 3.45M.
U.S. Jobless Claims Rise More Than Forecast

JPMorgan (JPM), a Dow stock, is likely to continue as the most profitable US bank when it reports earnings, but Wells Fargo (WFC) is closing in. JPM is projected to report a record $18.5B in 2011 earnings (when adjusted for one-time items), a 6% increase. Profit at WFC is estimated to have jumped more than 4 times as much, to an all-time high of $15.3B. By focusing on the US & eschewing traditional Wall Street businesses, WFC surpassed earnings at Goldman Sachs (GS) & Citigroup (C). for 6 consecutive qtrs. WFC, with $1.3T in assets is the 4th-largest UB bank, also has higher valuations than its bigger peers. It will be interesting to see how the markets react to earnings releases from the banks.
JPMorgan Set to Post Record 2011 Profit as Wells Fargo Closes Earnings Gap
Wells Fargo & Company (WFC)
While not a lot is happening in the markets, the bias switched to negative. Everybody is waiting for earnings reports. The article above indicates bank earnings might be mixed. Earnings should be fairly good, but there will be more to their stories in the details. An indication of more layoffs will also cast a cloud over a healthy image. Concerns about the European debt mess are easing today, but they are subject to wide swings. Dow has not been surging, but is holding well above the 11.2K level & is up YTD, a good sign for the bulls.
Dow Industrials
Get your favorite symbols' Trend Analysis TODAY!


No comments:
Post a Comment