Dow was up 27 after losing some of its early gains, advancers just ahead of decliners & NAZ slid 3. Bank stocks are leading the markets & have also lost early gains.
The MLP index slipped from its record 401 while the REIT index rose 1+ to 247 (near its 12 month highs of 250). Junk bond funds were little changed but Treasuries rose. Oil went back over $100 & gold shot up to a 6 week high on increased inflation concerns.
Photo: Yahoo
The claims for unemployment benefits rose last week to 377K, after a nearly 4 year low the previous week. The Labor Dept said weekly applications increased 21K. Applications had plummeted 2 weeks ago to their lowest level since Apr 2008. The 4 week average was down to 377K. Applications have trended downward over the past few months. The average has fallen about 9% in 4 months. Unemployment applications have been particularly volatile this month because employers cut temporary workers hired for the holidays. Adjustments for seasonal trends can be difficult.
Jobless Claims in U.S. Rise, Displaying Seasonal Volatility
Photo: Yahoo
There were fewer new homes bought in Dec, making 2011 the worst sales year on record. The Commerce Dept said new-home sales fell last month to an annual pace of just 307K, less than half the 700K that are sold in a healthy economy. About 302K homes were sold last year, less than the 323K sold in 2010. The median sales prices for new homes dropped in Dec, as builders continued to slash prices, falling 2.5% to $210K. Homebuilders are slightly more hopeful & hiring has improved, which is critical to a housing rebound. But housing is a long way from fully recovering. Builders have stopped working on many projects because it's been hard for them to get financing or to compete with cheaper resale homes. Though new-home sales represent less than 10% of the housing market, they have an outsize impact on the economy. Each home built creates an average of 3 jobs for a year & generates about $90K in tax revenue. A key reason for the dismal 2011 sales is that builders must compete with foreclosures & short sales, when lenders accept less for a house than what is owed on the mortgage
New Home Sales in U.S. Fell in December
Photo: Yahoo
Caterpillar, a Dow stock, reported EPS of $2.32 in Q4, up from $1.47 in 2010. Revenue jumped 24% to $17.2. Results easily topped predictions of $1.76 on $16B in revenue. It expects the global economy to grow about 3.3% this year, with the US economy growing at least 3%. In addition, US construction spending, which has been on the decline since 2004, should finally begin to recover. The company warned that while Europe's economic crisis probably won't trigger a global recession, economic growth in eurozone counties probably won't improve until H2. It sees China's economy growing 8.5% in 2012, with more construction & rising demand for commodities bringing more machine sales. CAT is guiding 2012 EPS at $9.25 on $68-$72B in revenue. In 2011, EPS was $7.40 up from $4.15. Sales increased to $60B from $42.6B . The stock rose 3.01.
Caterpillar 4Q profit rises, tops Wall St. viewAP

Markets are not sure what to do next after soft macro economic data. AT&T (T) & 3M (MMM), Dow stocks & Dividend Aristocrats, reported earnings. T fell while MMM was higher. The € is $1.31½, up from $1.27 a few week ago, on optimism about another bailout for Greece. But that's up in the air. The announcement by the Federal Reserve to keep interest rate slow for some time is not getting as big a reaction as it would if market conditions were more favorable. Earnings continue to be mushy, a mixture of this & that. After earnings season cools off, domestic attention will switch to DC. Extending tax cuts & federal unemployment benefits is uncertain because DC is divided.

S&P 500 Financials Sector Index
| Value | 190.19 | |
| Change | -1.16 (-0.6%) |
The MLP index slipped from its record 401 while the REIT index rose 1+ to 247 (near its 12 month highs of 250). Junk bond funds were little changed but Treasuries rose. Oil went back over $100 & gold shot up to a 6 week high on increased inflation concerns.
Alerian MLP Index
| Value | 400.94 | |
| Change | -0.63 (-0.2%) |
Treasury yields:
U.S. 3-month | 0.036% | |
U.S. 2-year | 0.215% | |
U.S. 10-year | 1.951% |
| CLH12.NYM | ...Crude Oil Mar 12 | ...101.18 | ..... | (1.8%) |
| GCF12.CMX | ...Gold Jan 12 | .........1,729.00 | ... | (1.7%) |
Get the latest daily market update below:
Photo: Yahoo
The claims for unemployment benefits rose last week to 377K, after a nearly 4 year low the previous week. The Labor Dept said weekly applications increased 21K. Applications had plummeted 2 weeks ago to their lowest level since Apr 2008. The 4 week average was down to 377K. Applications have trended downward over the past few months. The average has fallen about 9% in 4 months. Unemployment applications have been particularly volatile this month because employers cut temporary workers hired for the holidays. Adjustments for seasonal trends can be difficult.
Jobless Claims in U.S. Rise, Displaying Seasonal Volatility
Photo: Yahoo
There were fewer new homes bought in Dec, making 2011 the worst sales year on record. The Commerce Dept said new-home sales fell last month to an annual pace of just 307K, less than half the 700K that are sold in a healthy economy. About 302K homes were sold last year, less than the 323K sold in 2010. The median sales prices for new homes dropped in Dec, as builders continued to slash prices, falling 2.5% to $210K. Homebuilders are slightly more hopeful & hiring has improved, which is critical to a housing rebound. But housing is a long way from fully recovering. Builders have stopped working on many projects because it's been hard for them to get financing or to compete with cheaper resale homes. Though new-home sales represent less than 10% of the housing market, they have an outsize impact on the economy. Each home built creates an average of 3 jobs for a year & generates about $90K in tax revenue. A key reason for the dismal 2011 sales is that builders must compete with foreclosures & short sales, when lenders accept less for a house than what is owed on the mortgage
New Home Sales in U.S. Fell in December
Photo: Yahoo
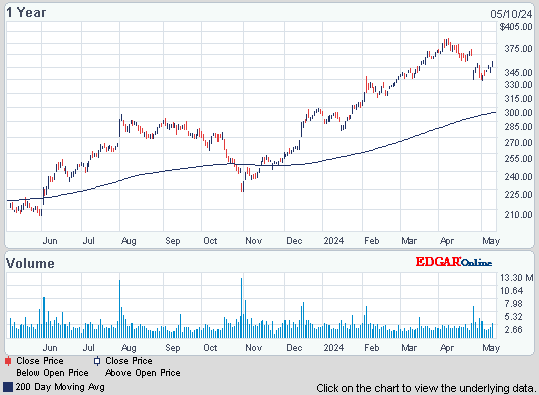
Caterpillar, a Dow stock, reported EPS of $2.32 in Q4, up from $1.47 in 2010. Revenue jumped 24% to $17.2. Results easily topped predictions of $1.76 on $16B in revenue. It expects the global economy to grow about 3.3% this year, with the US economy growing at least 3%. In addition, US construction spending, which has been on the decline since 2004, should finally begin to recover. The company warned that while Europe's economic crisis probably won't trigger a global recession, economic growth in eurozone counties probably won't improve until H2. It sees China's economy growing 8.5% in 2012, with more construction & rising demand for commodities bringing more machine sales. CAT is guiding 2012 EPS at $9.25 on $68-$72B in revenue. In 2011, EPS was $7.40 up from $4.15. Sales increased to $60B from $42.6B . The stock rose 3.01.
Caterpillar 4Q profit rises, tops Wall St. viewAP
Caterpillar, Inc. (CAT)
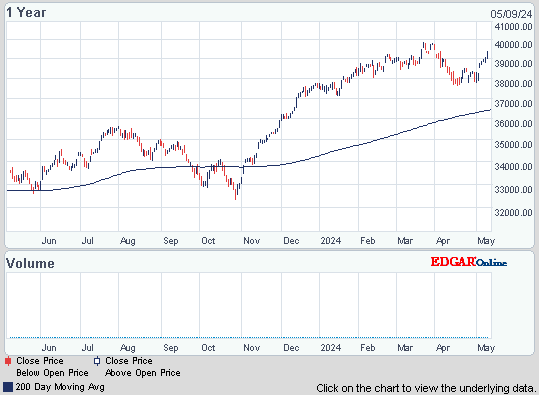
Markets are not sure what to do next after soft macro economic data. AT&T (T) & 3M (MMM), Dow stocks & Dividend Aristocrats, reported earnings. T fell while MMM was higher. The € is $1.31½, up from $1.27 a few week ago, on optimism about another bailout for Greece. But that's up in the air. The announcement by the Federal Reserve to keep interest rate slow for some time is not getting as big a reaction as it would if market conditions were more favorable. Earnings continue to be mushy, a mixture of this & that. After earnings season cools off, domestic attention will switch to DC. Extending tax cuts & federal unemployment benefits is uncertain because DC is divided.
Dow Industrials
Get your favorite symbols' Trend Analysis TODAY!


No comments:
Post a Comment