Dow dropped 81, decliners ahead of advancers 4-3 & NAZ lost a very big 38. The MLP index rose a fraction to the 449s & the REIT index slid a fraction to 294. Junk bond funds were higher & Treasuries crawled higher. Oil rose from a 4-month low on signals that recent losses were
exaggerated & as Spain sold more debt than planned. Gold was higher after its plunge of more than 100 earlier this week.
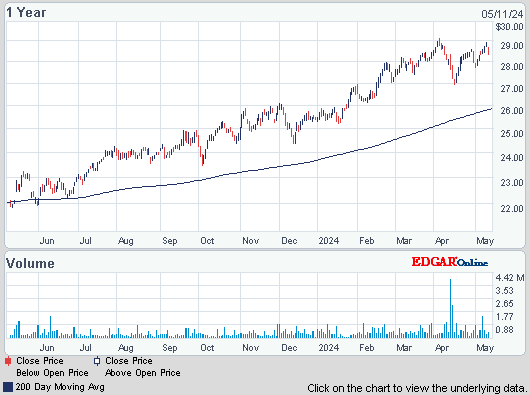
AMJ (Alerian MLP Index tracking fund)

![Live 24 hours gold chart [Kitco Inc.]](http://www.kitco.com/images/live/gold.gif)

The head of the IMF says the US, Europe, Japan & China all need to make adjustments to their current economic policies in order to boost a still-struggling global economy. Managing Director Christine Lagarde says the US & many countries in Europe need to focus more on growth & less on trimming budget balances this year. She said there was a critical need for policies focused on spurring jobs because "we need growth, first and foremost." Lagarde was previewing upcoming discussions among finance ministers & central bank governors of the world's 20 major economies plus the spring meetings of the 188-nation IMF & its sister lending institution, the World Bank.
IMF chief says global pro-growth policies needed AP

Photo: Bloomberg
Manufacturing in the Philadelphia region expanded in Apr at a slower pace than projected as fewer orders prompted managers cut back on hiring & inventories. The Federal Reserve Bank of Philadelphia’s general economic index fell to 1.3 in Apr from 2 in the prior month. Readings greater than zero signal expansion in the area covering eastern PA, southern NJ & Del. The forecast called for a gain to 3. The data follow a report last week showing expansion also cooled at factories in the NY Fed region. This week, separate data from the Federal Reserve indicated output at factories is moderating as companies try to limit inventories as the world’s largest economy slows after gaining speed in Q1. The Philadelphia Fed’s new orders measure fell to minus 1 from 0.5 in Mar, while shipments climbed to 9.1 from 3.5. The inventory index dropped to minus 22.2, the weakest since Oct 2009, from zero. A measure of employment decreased to minus 6.8 from 2.7. The measure of prices paid eased to 3.1, the weakest since Jul 2009, from 8.5 in Mar. An index of prices received decreased to minus 7.5, the lowest since Aug 2010, from minus 0.8.
Philadelphia Fed Manufacturing Index Fell to 1.3 in April
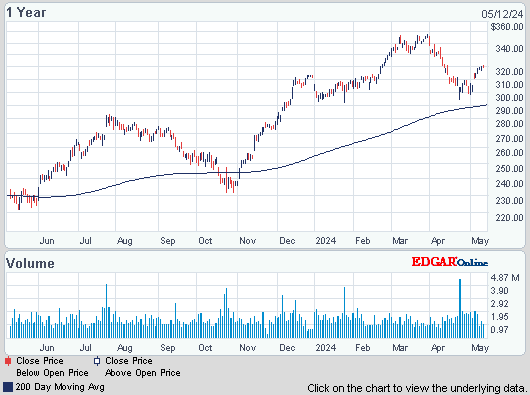
Sherwin-Williams, a Dividend Aristocrat, Q1 net income rose 16%, helped by better results at its paint stores & global finishes businesses. EPS was $1.11, up from 95¢ last year. Revenue inched up 1% to $2.17B from $2.14B, helped by contributions from a recent acquisition & higher sales volumes at the paint store business. The profit beat predictions, while the revenue fell slightly short. Analysts expected EPS of $1.09 on $2.22B in revenue. Paint store sales rose 4% to $1.17B on higher demand for architectural paint, while sales at the company's consumer business fell 4% to $308M. Global finishes sales increased 1% to $486M, but profit at the business increased 19% on higher selling prices & better efficiency. SHW projected EPS in Q2 of $2.50-$2.60 on sales growth of 5-9%, implying revenue of $2.7-$2.8B. Analysts expect EPS of $2.58 on $2.93B in revenue. The company also backed its previous full-year profit EPS guidance of $7.45-$7.55 & also said it expects sales to rise above 2012 levels by a "mid-single-digit percentage." The company reported $9.53B revenue for 2012. Analysts project EPS of $8.02, with estimates ranging from $7.50-$9.50, on revenue of $10.68B. The stock ended with a 3.99 gain after reaching a new all-time high earlier in trading.
Sherwin-Williams 1st-qtr net income rises 16 pct AP

Stocks extended their losses with sellers taking over, the economic backdrop has been weak to dismal. The latest data indicates what strength the US economy had last year is evaporating. Federal budget cutbacks & higher taxes on working consumers are taking their toll. Meanwhile Europe is struggling to work its way out of a recession despite austere gov budgets & China is experiencing its slowest growth in years. With today's drop, Dow is down 41 this month & heading lower. Earnings can not be expected to bring out buyers. Apple (AAPL) fell again today (10+) bringing its YTD loss to a massive 140.
AMJ (Alerian MLP Index tracking fund)
Treasury yields:
U.S. 3-month |
0.048% | |
U.S. 2-year |
0.228% | |
U.S. 10-year |
1.684% |
| CLK13.NYM | ...Crude Oil May 13 | ....87.55 | (1.0%) |
![Live 24 hours gold chart [Kitco Inc.]](http://www.kitco.com/images/live/gold.gif)

The head of the IMF says the US, Europe, Japan & China all need to make adjustments to their current economic policies in order to boost a still-struggling global economy. Managing Director Christine Lagarde says the US & many countries in Europe need to focus more on growth & less on trimming budget balances this year. She said there was a critical need for policies focused on spurring jobs because "we need growth, first and foremost." Lagarde was previewing upcoming discussions among finance ministers & central bank governors of the world's 20 major economies plus the spring meetings of the 188-nation IMF & its sister lending institution, the World Bank.
IMF chief says global pro-growth policies needed AP

Photo: Bloomberg
Manufacturing in the Philadelphia region expanded in Apr at a slower pace than projected as fewer orders prompted managers cut back on hiring & inventories. The Federal Reserve Bank of Philadelphia’s general economic index fell to 1.3 in Apr from 2 in the prior month. Readings greater than zero signal expansion in the area covering eastern PA, southern NJ & Del. The forecast called for a gain to 3. The data follow a report last week showing expansion also cooled at factories in the NY Fed region. This week, separate data from the Federal Reserve indicated output at factories is moderating as companies try to limit inventories as the world’s largest economy slows after gaining speed in Q1. The Philadelphia Fed’s new orders measure fell to minus 1 from 0.5 in Mar, while shipments climbed to 9.1 from 3.5. The inventory index dropped to minus 22.2, the weakest since Oct 2009, from zero. A measure of employment decreased to minus 6.8 from 2.7. The measure of prices paid eased to 3.1, the weakest since Jul 2009, from 8.5 in Mar. An index of prices received decreased to minus 7.5, the lowest since Aug 2010, from minus 0.8.
Philadelphia Fed Manufacturing Index Fell to 1.3 in April
Sherwin-Williams, a Dividend Aristocrat, Q1 net income rose 16%, helped by better results at its paint stores & global finishes businesses. EPS was $1.11, up from 95¢ last year. Revenue inched up 1% to $2.17B from $2.14B, helped by contributions from a recent acquisition & higher sales volumes at the paint store business. The profit beat predictions, while the revenue fell slightly short. Analysts expected EPS of $1.09 on $2.22B in revenue. Paint store sales rose 4% to $1.17B on higher demand for architectural paint, while sales at the company's consumer business fell 4% to $308M. Global finishes sales increased 1% to $486M, but profit at the business increased 19% on higher selling prices & better efficiency. SHW projected EPS in Q2 of $2.50-$2.60 on sales growth of 5-9%, implying revenue of $2.7-$2.8B. Analysts expect EPS of $2.58 on $2.93B in revenue. The company also backed its previous full-year profit EPS guidance of $7.45-$7.55 & also said it expects sales to rise above 2012 levels by a "mid-single-digit percentage." The company reported $9.53B revenue for 2012. Analysts project EPS of $8.02, with estimates ranging from $7.50-$9.50, on revenue of $10.68B. The stock ended with a 3.99 gain after reaching a new all-time high earlier in trading.
Sherwin-Williams 1st-qtr net income rises 16 pct AP
Sherwin-Williams (SHW)
Stocks extended their losses with sellers taking over, the economic backdrop has been weak to dismal. The latest data indicates what strength the US economy had last year is evaporating. Federal budget cutbacks & higher taxes on working consumers are taking their toll. Meanwhile Europe is struggling to work its way out of a recession despite austere gov budgets & China is experiencing its slowest growth in years. With today's drop, Dow is down 41 this month & heading lower. Earnings can not be expected to bring out buyers. Apple (AAPL) fell again today (10+) bringing its YTD loss to a massive 140.


No comments:
Post a Comment