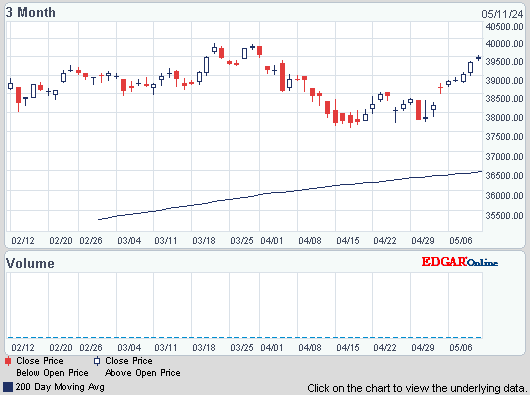
Dow dropped 43, decliners ahead of advancers 2-1 & NAZ fell 28. The Financial Index was off 1+ to the 244s. The MLP index slipped 1 from its record high & the REIT index lost 1 to the 285s. Junk bond funds were mixed & Treasuries inched higher. Oil lost ground but gold found a little buying.
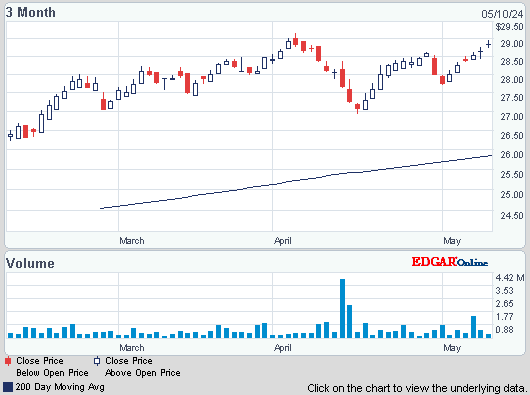
AMJ (Alerian MLP Index tracking fund)


Photo: Bloomberg
US manufacturing expanded less than forecast in Mar as factories slowed production & orders waned. The Institute for Supply Management factory index fell to 51.3 from the prior month’s 54.2 (the highest level since Jun 2011). The 2.9-point decline was the biggest since July 2011. A reading of 50 is the dividing line between expansion & contraction. The forecast was 54. Limited improvement in the global economy & concern about the effects on the US expansion from automatic cuts in federal spending may be prompting some companies to cut back. At the same time, progress in the housing industry & resilient consumer demand will help to cushion the hit, keeping American factories running. The index of production decreased to a 6-month low of 52.2 from 57.6 in Feb (the highest level since last Apr). The new orders measure dropped to 51.4 from 57.8. The employment gauge increased to 54.2, the highest since Jun, from 52.6. The gauge of export demand rose to 56, the strongest reading in almost a year, from 53.5. The measure of orders waiting to be filled fell to 51 from 55 & the inventory index decreased to 49.5 from 51.5, while a gauge of customer stockpiles rose to 47.5 from 46.5. The index of prices paid decreased to 54.5 from 61.5. All is not well with the US economy.
Construction spending in the US.
rose in Feb, paced by the highest level of home building in
more than 4 years. Outlays climbed 1.2% to an $885B annual
rate, following a 2.1% decrease in Jan, the Commerce
Dept reported. The forecast called for a 1% rise. Near record-low borrowing costs & an improved outlook for
jobs are lifting demand for residential real estate, giving a
boost to homebuilders. Construction spending increased 6.6% in the 12
months ended in Feb (before adjusting for seasonal
variations). Private construction spending advanced 1.3% from the
prior month. In housing, outlays climbed 2.2% to a $303B
annualized pace, the strongest since Nov 2008. The gain was
led by single-family projects, which increased 4.3%, &
a 0.5% increase in home-improvement spending. Private
non-residential projects rose 0.4%, led by construction
of power plants & health-care facilities. Spending on public construction climbed 0.9% from
the prior month, the biggest advance since Aug. State &
local agencies led the advance, while federal outlays dropped
1.1%, a 2nd consecutive decrease. However, the ISM data above is more recent.
Construction Spending in U.S. Rises on Gain in Home Building
Growth in China's manufacturing picked up in Mar, a potentially positive sign for the recovery in the world's 2nd-largest economy. The China Federation of Logistics & Purchasing said that its Purchasing Managers' Index rose to 50.9 in Mar from 50.1 in Feb, which was the lowest reading in 5 months. Numbers above 50 denote expansion. Chinese manufacturing is closely watched as an indicator of global consumer sales & potential demand for countries that supply its factories with raw materials & industrial components. China's economic growth rebounded to 7.9% in Q4 following its deepest slowdown since the 2008 global crisis. But there are concerns that the recovery will be weak & gradual, & growth could be vulnerable if trade or investment weakens. The federation said that the improvement in factory production was largely due to an increase in orders & less pressure for prices of manufacturing inputs to rise.
Markets are starting the new month with selling. The manufacturing data is an indication that the US economy is more sluggish than many are estimating. Dow has lost 60 from its early AM peak, both NAZ & Dow are drifting lower. After a stellar Q1, stock markets are overbought & subject to selling. Fri is the big jobs report & next Tues is Aloca (AA), a Dow stock, with the first major earnings report.
Dow Jones Industrials

AMJ (Alerian MLP Index tracking fund)
Treasury yields:
U.S. 3-month |
0.074% | |
U.S. 2-year |
0.244% | |
U.S. 10-year |
1.843% |
| CLN13.NYM | ...Crude Oil Jul 13 | ...96.73 | (0.9%) |
| GCK13.CMX | ...Gold May 13 | ...1,597.40 | (0.1%) |

Photo: Bloomberg
US manufacturing expanded less than forecast in Mar as factories slowed production & orders waned. The Institute for Supply Management factory index fell to 51.3 from the prior month’s 54.2 (the highest level since Jun 2011). The 2.9-point decline was the biggest since July 2011. A reading of 50 is the dividing line between expansion & contraction. The forecast was 54. Limited improvement in the global economy & concern about the effects on the US expansion from automatic cuts in federal spending may be prompting some companies to cut back. At the same time, progress in the housing industry & resilient consumer demand will help to cushion the hit, keeping American factories running. The index of production decreased to a 6-month low of 52.2 from 57.6 in Feb (the highest level since last Apr). The new orders measure dropped to 51.4 from 57.8. The employment gauge increased to 54.2, the highest since Jun, from 52.6. The gauge of export demand rose to 56, the strongest reading in almost a year, from 53.5. The measure of orders waiting to be filled fell to 51 from 55 & the inventory index decreased to 49.5 from 51.5, while a gauge of customer stockpiles rose to 47.5 from 46.5. The index of prices paid decreased to 54.5 from 61.5. All is not well with the US economy.
Construction Spending in U.S. Rises on Gain in Home Building
Growth in China's manufacturing picked up in Mar, a potentially positive sign for the recovery in the world's 2nd-largest economy. The China Federation of Logistics & Purchasing said that its Purchasing Managers' Index rose to 50.9 in Mar from 50.1 in Feb, which was the lowest reading in 5 months. Numbers above 50 denote expansion. Chinese manufacturing is closely watched as an indicator of global consumer sales & potential demand for countries that supply its factories with raw materials & industrial components. China's economic growth rebounded to 7.9% in Q4 following its deepest slowdown since the 2008 global crisis. But there are concerns that the recovery will be weak & gradual, & growth could be vulnerable if trade or investment weakens. The federation said that the improvement in factory production was largely due to an increase in orders & less pressure for prices of manufacturing inputs to rise.
Markets are starting the new month with selling. The manufacturing data is an indication that the US economy is more sluggish than many are estimating. Dow has lost 60 from its early AM peak, both NAZ & Dow are drifting lower. After a stellar Q1, stock markets are overbought & subject to selling. Fri is the big jobs report & next Tues is Aloca (AA), a Dow stock, with the first major earnings report.
Dow Jones Industrials


No comments:
Post a Comment