

Dow went up 114 to a new record high, advancers ahead of decliners 3-1 & NAZ added 13. The MLP index jumped 4+ to the 466s & the REIT index rose 2+ to the 292s. Junk bond funds edged higher & Treasuries fell as the stock market rose. Oil rose to 107, the
highest level this year, as fewer Americans than forecast filed
applications for unemployment benefits. Gold also climbed
AMJ (Alerian MLP Index tracking fund)
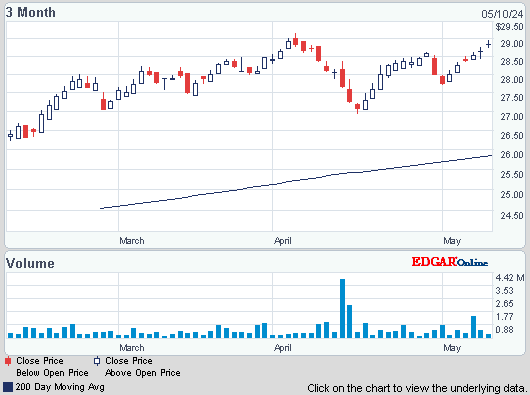


Photo: Yahoo
New claims for jobless benefits dropped last week to their lowest level in 4 months, a positive sign for hiring that could bolster expectations the Federal Reserve will ease its monetary stimulus this year. Initial claims for benefits fell 24K to 334K, according to the Labor Dept. It was the lowest reading since Mar & a steeper fall than expected. But jobless claims can be volatile in Jul because many factories close to retool during the period, & it is difficult to adjust the data for seasonal swings because shutdown schedules vary from year to year. Still, a 4-week average fell 5K from a week earlier. The reading appears to back the case for the Federal Reserve to begin winding down programs to support the economy later this year. Compared to the same survey week in Jun, the 4-week average for claims was 0.7% lower last week. The claims report showed the number still receiving benefits under regular state programs after an initial week of aid rose 91K to 3.1M.
U.S. Jobless Claims Decline on Auto Factory Shutdowns
A gauge of the economy's future health was unchanged in Jun, pointing to modest growth in the coming months. The Conference Board index of leading indicators remained at 95.3 in Jun, following an increases of 0.2% in May & 0.8% in Apr. But the longer-term trend has been positive as the index increased 1.7% in H1. That's better than the 1.1% rise in the previous 6 months. The index consists of previously released data & is intended to signal economic conditions 3-6 months out. Positive trends, such as higher consumer confidence & fewer applications for unemployment benefits, were offset by last month's decline in stock prices & a drop in building permits.
Gauge of US economy's future unchanged in June Associated Press
Sherwin-Williams, a Dividend Aristocrat, stock fell after reporting disappointing Q2 results, issued a weak outlook for Q3 & said that Mexican regulators had rejected its bid to buy a Mexican paint company. Q2 EPS was $2.46, up 13% from $2.17 last year. Excluding a charge related to its Brazilian operations, EPS was $2.54. Revenue rose 5% to $2.7B, helped by higher sales volumes in its paint stores. Results fell short of predictions. Analysts expected EPS of $2.57 on $2.76B in revenue. Sales at the paint stores group increased 8% to $1.6B, mainly as a result of higher sales of architectural paint. In addition sales at the company's global finishes group increased by 3% to $513M. For Q3, the company projected EPS of $2.55-$2.65 on sales growth of 6-9%. Based on year-ago results, the guidance implies Q3 revenue of $2.76-$2.83B. Analysts are expecting EPS of $2.72 on $3.03B in revenue. The company backed its full-year EPS guidance of $7.45-$7.55 & said it expects a "mid-single-digit percentage" increase in sales. Analysts expect a profit of $7.94 per share. Also, SHW said Mexican regulators voted not to approve its planned $2.3B acquisition of privately held paint company Consorcio Comex. The stock sank 11.90.
Sherwin-Williams shares fall on weak 2Q results Associated Press
Traders liked what they heard, especially about the jobless claims, & are bidding up stocks. As usual, results vary form one sector to the next. The MLP index is essentially at its record high, the REIT index is about 8% below its recent highs & junk bond funds are typically about 10% under recent highs. More importantly, the yield on the 10 year Treasury bond is almost 1% higher than its lows 4 months ago. The stock markets needs low interest rates for its advances, but that will not last.
Dow Jones Industrials
AMJ (Alerian MLP Index tracking fund)
Treasury yields:
U.S. 3-month |
0.03% | |
U.S. 2-year |
0.31% | |
U.S. 10-year |
2.52% |
| CLQ13.NYM | ...Crude Oil Aug 13 | ...106.90 |
| GCN13.CMX | ...Gold Jul 13......... | 1,281.00 |
 gesture and shake hands as they talk with job seekers at a Hire Our Heroes job fair targeting unemployed military veterans and sponsored by the Cable Show, a cable television industry trade show in Washington, June 11, 2013. REUTERS/Jonathan Ernst")
New claims for jobless benefits dropped last week to their lowest level in 4 months, a positive sign for hiring that could bolster expectations the Federal Reserve will ease its monetary stimulus this year. Initial claims for benefits fell 24K to 334K, according to the Labor Dept. It was the lowest reading since Mar & a steeper fall than expected. But jobless claims can be volatile in Jul because many factories close to retool during the period, & it is difficult to adjust the data for seasonal swings because shutdown schedules vary from year to year. Still, a 4-week average fell 5K from a week earlier. The reading appears to back the case for the Federal Reserve to begin winding down programs to support the economy later this year. Compared to the same survey week in Jun, the 4-week average for claims was 0.7% lower last week. The claims report showed the number still receiving benefits under regular state programs after an initial week of aid rose 91K to 3.1M.
U.S. Jobless Claims Decline on Auto Factory Shutdowns
A gauge of the economy's future health was unchanged in Jun, pointing to modest growth in the coming months. The Conference Board index of leading indicators remained at 95.3 in Jun, following an increases of 0.2% in May & 0.8% in Apr. But the longer-term trend has been positive as the index increased 1.7% in H1. That's better than the 1.1% rise in the previous 6 months. The index consists of previously released data & is intended to signal economic conditions 3-6 months out. Positive trends, such as higher consumer confidence & fewer applications for unemployment benefits, were offset by last month's decline in stock prices & a drop in building permits.
Gauge of US economy's future unchanged in June Associated Press
Sherwin-Williams, a Dividend Aristocrat, stock fell after reporting disappointing Q2 results, issued a weak outlook for Q3 & said that Mexican regulators had rejected its bid to buy a Mexican paint company. Q2 EPS was $2.46, up 13% from $2.17 last year. Excluding a charge related to its Brazilian operations, EPS was $2.54. Revenue rose 5% to $2.7B, helped by higher sales volumes in its paint stores. Results fell short of predictions. Analysts expected EPS of $2.57 on $2.76B in revenue. Sales at the paint stores group increased 8% to $1.6B, mainly as a result of higher sales of architectural paint. In addition sales at the company's global finishes group increased by 3% to $513M. For Q3, the company projected EPS of $2.55-$2.65 on sales growth of 6-9%. Based on year-ago results, the guidance implies Q3 revenue of $2.76-$2.83B. Analysts are expecting EPS of $2.72 on $3.03B in revenue. The company backed its full-year EPS guidance of $7.45-$7.55 & said it expects a "mid-single-digit percentage" increase in sales. Analysts expect a profit of $7.94 per share. Also, SHW said Mexican regulators voted not to approve its planned $2.3B acquisition of privately held paint company Consorcio Comex. The stock sank 11.90.
Sherwin-Williams shares fall on weak 2Q results Associated Press
Sherwin-Williams (SHW)
Traders liked what they heard, especially about the jobless claims, & are bidding up stocks. As usual, results vary form one sector to the next. The MLP index is essentially at its record high, the REIT index is about 8% below its recent highs & junk bond funds are typically about 10% under recent highs. More importantly, the yield on the 10 year Treasury bond is almost 1% higher than its lows 4 months ago. The stock markets needs low interest rates for its advances, but that will not last.
Dow Jones Industrials


No comments:
Post a Comment