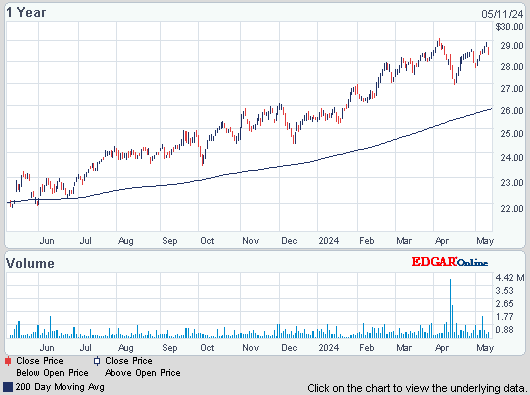
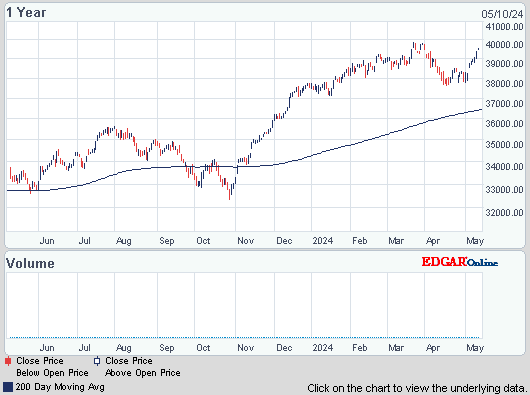
Dow fell 4, advancers & decliners were about equal & NAZ dropped a very big 23. The MLP index went up 1+ to the 461s while the REIT index was down fractionally to 292. Junk bond funds slid lower & Treasuries advanced. Oil capped
a 4th weekly gain as the US showed signs of economic
recovery & on speculation that the monthly increase has been
excessive. WTI (Texas oil) exceeded Brent (European oil) for the first time since 2010. Gold continued its climb, trying to get back over 1300.
AMJ (Alerian MLP Index tracking fund)
![Live 24 hours gold chart [Kitco Inc.]](http://www.kitco.com/images/live/gold.gif)


Photo: Bloomberg
China eliminated the lower limit on lending rates offered by the nation’s financial institutions as economic growth slows & authorities expand the role of markets in its economy. The change eliminates a limit set at 30% below the current 6% benchmark, according to the People’s Bank of China. The central bank left a deposit-rate cap unchanged. The PBOC acknowledged that it was a limited step & said that freeing up deposit rates would be more important. The shift came as finance ministers from G-20 nations gathered in Moscow, & after a cash squeeze in money markets curbed a record expansion in China’s credit. Yesterday’s move will lower companies’ funding costs & boost financial institutions’ pricing capabilities, the PBOC said. In Mar, only 11% of loans were priced below the lending benchmark. The nation’s economy grew 7.5% in Q2 from a year earlier & is at risk of the weakest expansion in 23 years.

Photo: Bloomberg
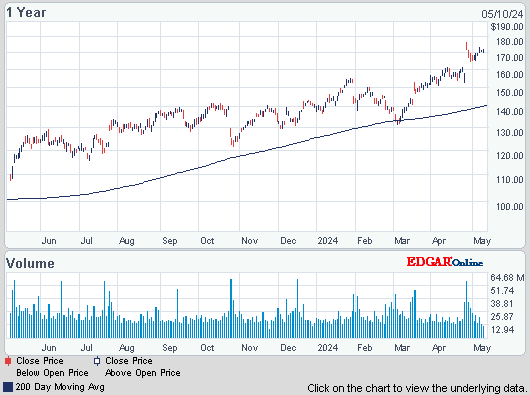
Google stock fell the most in 9 months after the owner it reported Q2 sales & profit that missed estimates as mobile advertising crimped average prices. Revenue, excluding sales passed on to partner sites, was $11.1B, under the estimate of $11.3B. EPS before certain items was $9.56, less than the $10.80 estimate. The average cost per click, a measure of advertising rates, fell 6% as more marketers aimed to reach consumers thru smartphones & tablets instead of desktop PCs. While the company has been adding tools for customers to reach mobile Web surfers, those efforts are still gaining steam. GOOG has to boost investment to help them catch on. Q2 EPS, which includes results from discontinued operations, increased to $9.54 from $8.42 a year earlier. Operating expenses amounted to 35% of total revenue, compared with 33% a year earlier, & the company’s effective tax rate was 24%. The average cost per click, the amount that advertisers paid each time a user clicked on a promotion on GOOG sites & those in its network, decreased more than the 3% drop predicted, following a 4% decline in Q1. The total number of paid clicks jumped 23%, after a 20% gain in Q1. Analysts were projecting a 19% increase. On this glum news, the stock sank 13.50.
Google Shares Decline as Shift to Mobile Crimps Average Advertising Prices
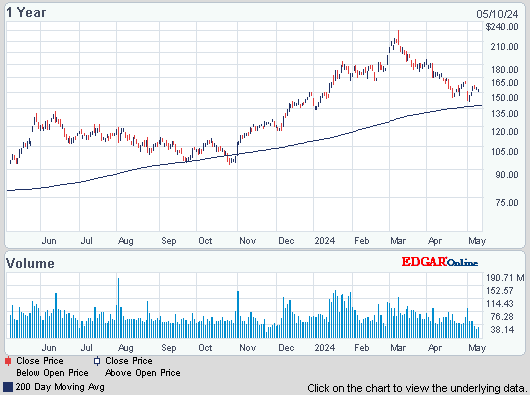
Advanced Micro Devices, the 2nd-biggest maker of PC processors, fell the most in 9 months after forecasting a drop in Q3 gross margin, even as it predicted higher sales. Gross margin will drop to about 36% in Q3 from 40% in Q2. CEO Rory Read is looking to get more than 20% of revenue from new sources, including from chips for game-console processors as the PC market shrinks. Revenue in the current period will rise 22%, plus or minus 3%, from $1.16B in Q2. That indicates a range of $1.38-$1.45B. Analysts estimated sales of $1.23B. In Q2, the net loss per share was 10¢, compared with a profit 5¢ a year earlier. Sales fell 18% to $1.16B, while analysts estimated $1.1B. AMD is on track to report net income in Q3, Read said. That hasn’t happened since last year & most of the improvement in revenue will come from console chip sales. While the PC market will grow “slightly” in H2 from H1, it will decline on an annual basis this year, Read said. The stock lost 61¢.
AMD Falls Most in 2 Months After Forecasting Lower Gross Margin
AMJ (Alerian MLP Index tracking fund)
Treasury yields:
U.S. 3-month |
0.02% | |
U.S. 2-year |
0.30% | |
U.S. 10-year |
2.49% |
| CLQ13.NYM | ...Crude Oil Aug 13 | ...107.69 | (0.3%) |
![Live 24 hours gold chart [Kitco Inc.]](http://www.kitco.com/images/live/gold.gif)


Photo: Bloomberg
China eliminated the lower limit on lending rates offered by the nation’s financial institutions as economic growth slows & authorities expand the role of markets in its economy. The change eliminates a limit set at 30% below the current 6% benchmark, according to the People’s Bank of China. The central bank left a deposit-rate cap unchanged. The PBOC acknowledged that it was a limited step & said that freeing up deposit rates would be more important. The shift came as finance ministers from G-20 nations gathered in Moscow, & after a cash squeeze in money markets curbed a record expansion in China’s credit. Yesterday’s move will lower companies’ funding costs & boost financial institutions’ pricing capabilities, the PBOC said. In Mar, only 11% of loans were priced below the lending benchmark. The nation’s economy grew 7.5% in Q2 from a year earlier & is at risk of the weakest expansion in 23 years.

Photo: Bloomberg
Google stock fell the most in 9 months after the owner it reported Q2 sales & profit that missed estimates as mobile advertising crimped average prices. Revenue, excluding sales passed on to partner sites, was $11.1B, under the estimate of $11.3B. EPS before certain items was $9.56, less than the $10.80 estimate. The average cost per click, a measure of advertising rates, fell 6% as more marketers aimed to reach consumers thru smartphones & tablets instead of desktop PCs. While the company has been adding tools for customers to reach mobile Web surfers, those efforts are still gaining steam. GOOG has to boost investment to help them catch on. Q2 EPS, which includes results from discontinued operations, increased to $9.54 from $8.42 a year earlier. Operating expenses amounted to 35% of total revenue, compared with 33% a year earlier, & the company’s effective tax rate was 24%. The average cost per click, the amount that advertisers paid each time a user clicked on a promotion on GOOG sites & those in its network, decreased more than the 3% drop predicted, following a 4% decline in Q1. The total number of paid clicks jumped 23%, after a 20% gain in Q1. Analysts were projecting a 19% increase. On this glum news, the stock sank 13.50.
Google Shares Decline as Shift to Mobile Crimps Average Advertising Prices
Google (GOOG)
Advanced Micro Devices, the 2nd-biggest maker of PC processors, fell the most in 9 months after forecasting a drop in Q3 gross margin, even as it predicted higher sales. Gross margin will drop to about 36% in Q3 from 40% in Q2. CEO Rory Read is looking to get more than 20% of revenue from new sources, including from chips for game-console processors as the PC market shrinks. Revenue in the current period will rise 22%, plus or minus 3%, from $1.16B in Q2. That indicates a range of $1.38-$1.45B. Analysts estimated sales of $1.23B. In Q2, the net loss per share was 10¢, compared with a profit 5¢ a year earlier. Sales fell 18% to $1.16B, while analysts estimated $1.1B. AMD is on track to report net income in Q3, Read said. That hasn’t happened since last year & most of the improvement in revenue will come from console chip sales. While the PC market will grow “slightly” in H2 from H1, it will decline on an annual basis this year, Read said. The stock lost 61¢.
AMD Falls Most in 2 Months After Forecasting Lower Gross Margin
Advanced Micro Devices (AMD)
Stocks have only been crawling higher for more than a week. Dow & S&P 500 are at record levels, but this market looks tired. The biggest letdown is the tech sector as the biggest companies have been reporting dismal numbers. The simple fact is the mighty PC industry is mature, like the auto industry was a few decades ago. It's not going away, but significant revenue growth is a thing of the past & high margins will be trimmed as companies have to chase increased sales. The rest of the business world is reporting fairly good earnings. But that comes largely from cutting costs & one time factors. Sales growth is only marginal.
Dow Jones Industrials
Dow Jones Industrials
I just got word from one of my friends at MarketClub, that for a very limited time, they’re opening up their premium service for a no-cost, 2 week trial! This isn’t a stripped down version, everything in MarketClub is available to you. I don’t want to give everything away, but you’ll have unlimited access to my favorite three tools: Trade Triangles, Smart Scan, and Alerts! The best part is that the MarketClub customer support team will be providing UNLIMITED support! You can call or email for an instant response to any question, comment or concern.
Here’s that link:
https://club.ino.com/join/specialtrial/index_free.html?a_aid=CD3289&a_bid=359ef9a3




No comments:
Post a Comment