

Dow sank 199, decliners over advancers more than 3-1 & NAZ dropped 75 (going below 5K). The MLP index slid 1+ to the 356s (down 200 from last year;s record highs) & the REIT index lost 2+ to the 321s. Junk bond funds continue to sell off & Treasuries gained taking the yield on the 10 year Treasury below 2.1%. Oil is weak while gold rose
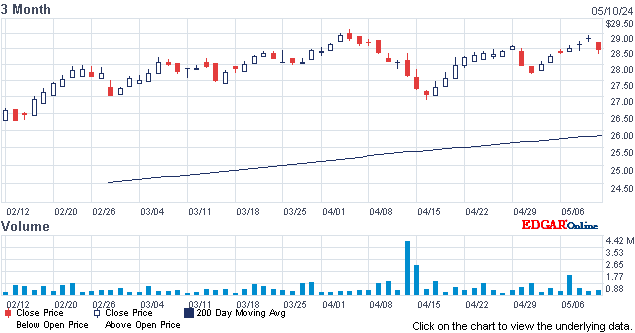
AMJ (Alerian MLP Index tracking fund)


Purchases of previously owned homes in the US unexpectedly rose in Jul to the highest level since 2007, consistent with further strength in the housing market. Contract closings increased 2% to a 5.59M annualized rate from the prior month’s revised 5.48M pace, according to the National Association of Realtors. The forecast called for a drop to 5.43M. Prices rose & inventory shrank. Employment gains & low borrowing costs are helping encourage trade-up purchases, providing a little more fuel for the economy. The data & a report earlier this week showing the strongest pace of new construction since 2007 are consistent with the Fed view that housing is improving. Compared with a year earlier, existing-house sales increased 10.3%. The median price of an existing home climbed 5.6% from Jul 2014 to reach $234K. While outsized gains in property values hurt affordability for prospective buyers, more gradual property appreciation helps make it easier for homeowners to sell their dwellings. First-time buyers accounted for 28% of all purchases, down from 30% a month earlier. All-cash transactions made up about 23%, down from 29% a year earlier & a sign that investors are gradually stepping out of the market. Distressed purchases, comprised of foreclosures & short sales, in which the lender agrees to a transaction for less than the balance of the mortgage, accounted for 7% of total, down from 8% in Jun. The number of previously owned homes on the market fell 0.4% to a 3-month low of 2.24M. At the current sales pace, it would take 4.8 months to sell those houses compared with 4.9 months at the end of Jun. Less than a five months’ supply is considered a tight market. “We have this broad-based housing shortage,” the NAR said. “Rents are rising fast, home prices are rising fast. This is a result of under-production.”
The number of Americans filing for unemployment benefits last week remained historically low as jobless claims increased 4K to 277K, according to the Labor Dept. The forecast projected 271K. Applications have been lower than 300K, associated with an improving job market, since early Mar. The subdued level of dismisals has been accompanied by falling unemployment & steady job gains, signs the labor market continues to heal in its 7th year of recovery. The 4-week average of claims climbed to 271K from 266K the week before (lowest in more than 40 years). The 255K applications filed in the week ended in Jul were the fewest since 1973. The number of people continuing to receive jobless benefits declined 24K to 2.25M.
China’s stocks slumped to a 2-week low as concern a slowing economy & weaker currency will spur capital outflows outweighed prospects for more state support. The Shanghai Composite Index dropped 3.4% to 3664, the lowest level since Aug 6. About 17% of mainland-listed shares remain halted. The Hang Seng China Enterprises Index sank 2.3% to a 10-month low, while the Hang Seng Index closed within 3 points of entering a bear market. Speculation about the degree of gov intervention in stocks has increased since the securities regulator indicated Fri that the state will reduce buying & data showed the richest traders were cashing out. China’s central bank injected the most funds in open-market operations since Feb as intervention to prop up the yuan strained the supply of cash & drove a key money-market rate to a 4-month high. The 3500 level has emerged as the latest make-or-break line for traders trying to gauge the staying power of state support. Signs of gov buying have appeared at that price on the Shanghai Composite at least 4 times over the past 6 weeks. Jul economic data from China showed industrial output, retail sales & fixed-asset investment all trailed estimates. Yuan positions at the central bank & financial institutions fell by the most on record last month, a sign capital outflows have picked up. The gov has armed a state agency with more than $400B to bolster share prices & told state-owned companies to buy stocks. It’s seeking to prop up the market after a drop of more than 30% in the Shanghai gauge threatened to undermine confidence in pres Xi Jinping’s ability to manage the economy.
Chinese Stocks Resume Rout on Economy, Capital Outflow Concerns
Times are tough in the stock market. Dow is down more than 600 YTD & 300 of that came this week. Nothing new going on, but a reality check of chaos around the world is sinking in. In its fall, Dow may test the 17K support level very soon. With all the gloomy feelings out there, that may not hold.
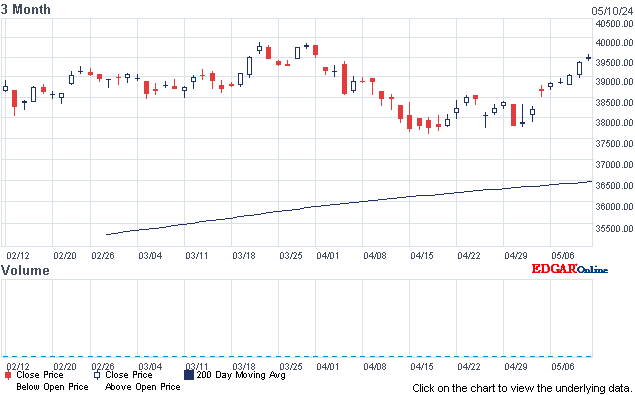
Dow Jones Industrials


AMJ (Alerian MLP Index tracking fund)
Purchases of previously owned homes in the US unexpectedly rose in Jul to the highest level since 2007, consistent with further strength in the housing market. Contract closings increased 2% to a 5.59M annualized rate from the prior month’s revised 5.48M pace, according to the National Association of Realtors. The forecast called for a drop to 5.43M. Prices rose & inventory shrank. Employment gains & low borrowing costs are helping encourage trade-up purchases, providing a little more fuel for the economy. The data & a report earlier this week showing the strongest pace of new construction since 2007 are consistent with the Fed view that housing is improving. Compared with a year earlier, existing-house sales increased 10.3%. The median price of an existing home climbed 5.6% from Jul 2014 to reach $234K. While outsized gains in property values hurt affordability for prospective buyers, more gradual property appreciation helps make it easier for homeowners to sell their dwellings. First-time buyers accounted for 28% of all purchases, down from 30% a month earlier. All-cash transactions made up about 23%, down from 29% a year earlier & a sign that investors are gradually stepping out of the market. Distressed purchases, comprised of foreclosures & short sales, in which the lender agrees to a transaction for less than the balance of the mortgage, accounted for 7% of total, down from 8% in Jun. The number of previously owned homes on the market fell 0.4% to a 3-month low of 2.24M. At the current sales pace, it would take 4.8 months to sell those houses compared with 4.9 months at the end of Jun. Less than a five months’ supply is considered a tight market. “We have this broad-based housing shortage,” the NAR said. “Rents are rising fast, home prices are rising fast. This is a result of under-production.”
Existing U.S. Home Sales Rise to Highest Since February 2007
The number of Americans filing for unemployment benefits last week remained historically low as jobless claims increased 4K to 277K, according to the Labor Dept. The forecast projected 271K. Applications have been lower than 300K, associated with an improving job market, since early Mar. The subdued level of dismisals has been accompanied by falling unemployment & steady job gains, signs the labor market continues to heal in its 7th year of recovery. The 4-week average of claims climbed to 271K from 266K the week before (lowest in more than 40 years). The 255K applications filed in the week ended in Jul were the fewest since 1973. The number of people continuing to receive jobless benefits declined 24K to 2.25M.
Firings Remain Subdued Even as U.S. Jobless Claims Increase
China’s stocks slumped to a 2-week low as concern a slowing economy & weaker currency will spur capital outflows outweighed prospects for more state support. The Shanghai Composite Index dropped 3.4% to 3664, the lowest level since Aug 6. About 17% of mainland-listed shares remain halted. The Hang Seng China Enterprises Index sank 2.3% to a 10-month low, while the Hang Seng Index closed within 3 points of entering a bear market. Speculation about the degree of gov intervention in stocks has increased since the securities regulator indicated Fri that the state will reduce buying & data showed the richest traders were cashing out. China’s central bank injected the most funds in open-market operations since Feb as intervention to prop up the yuan strained the supply of cash & drove a key money-market rate to a 4-month high. The 3500 level has emerged as the latest make-or-break line for traders trying to gauge the staying power of state support. Signs of gov buying have appeared at that price on the Shanghai Composite at least 4 times over the past 6 weeks. Jul economic data from China showed industrial output, retail sales & fixed-asset investment all trailed estimates. Yuan positions at the central bank & financial institutions fell by the most on record last month, a sign capital outflows have picked up. The gov has armed a state agency with more than $400B to bolster share prices & told state-owned companies to buy stocks. It’s seeking to prop up the market after a drop of more than 30% in the Shanghai gauge threatened to undermine confidence in pres Xi Jinping’s ability to manage the economy.
Chinese Stocks Resume Rout on Economy, Capital Outflow Concerns
Times are tough in the stock market. Dow is down more than 600 YTD & 300 of that came this week. Nothing new going on, but a reality check of chaos around the world is sinking in. In its fall, Dow may test the 17K support level very soon. With all the gloomy feelings out there, that may not hold.
Dow Jones Industrials
No comments:
Post a Comment