This blog gives investors more financial information for very smart investing!
Monday, August 24, 2015
Stock and commodity markets collapse around the globe
Dow sank 652, decliners over advancers 20-1 (don't see that often!) & NAZ fell an enormous 213. The MLP index tumbled 15 to the 327s & the REIT index lost 7+ to the 307s. Junk bond funds dropped 3-5% (big for them) & Treasuries surged, taking the yield on the 10 year Treasury down to nearly 1.9%. Oil sank (see below) along with all other markets while gold managed a modest gain as a safe investment.
Stocks fell, tracking a selloff in global equity markets, amid a deepening rout in all but the safest assets. The S&P 500 slid almost 5%, hitting its lowest level since
Oct. Calm in the US market shattered last week, with volatility soaring by the most on record as the Dow
entered a correction & investors dumped the biggest winners of 2015. A
gauge of volatility expectations more than doubled last week. Shares
succumbed to a global selloff that’s wiped more than $5T off the
value of equities around the world since China’s shock currency
devaluation on Aug 11. Moreover, speculation had been building all year
for the Federal Reserve to raise interest rates in Sep for the
first time since 2006, following the end of quantitative easing in 2014. Traders are now pricing in less than a one-in-three chance the
central bank will act next month, from about 48% just before the
yuan devaluation, as the rout in equity markets has shaken confidence
that the global economy will be strong enough to withstand higher US
rates. Despite the selloff, the benchmark index
has avoided the corrections & bear markets afflicting stocks from Sao
Paulo to Shanghai. It was only Fri that the S&P 500 capped its
single 5% decline of the year, spending the previous 7 months
locked in a trading range that had no precedent in a century of market
history.
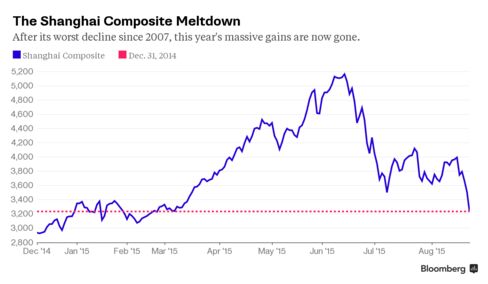
China’s stocks plunged the most since 2007 as gov support
measures failed to allay investor concern that a slowdown in economy is deepening. The Shanghai Composite Index tumbled 8.5% to 3,209 to erase its gains for the year. The Hang Seng China Enterprises
Index of Chinese stocks in Hong Kong fell 5.8% to its lowest
level since Mar 2014.
Worsening
economic data & signs of capital outflows are undermining
unprecedented gov attempts to shore up the $6T
stock market. While China said over the weekend it will allow pension
funds to buy shares for the first time, a speculated cut in bank reserve
ratios failed to materialize. More than 800 stocks fell by the daily 10% limit on the
Shanghai Composite & the gauge has tumbled 38% from its Jun
12 peak to wipe out more than $4T of value. It is believed that economic growth slowed to 6.6% in
Jul. China’s first major
economic indicator for Aug signaled a further deterioration as a
private manufacturing index fell to the lowest level in 6 years. Yuan positions at the central bank &
financial institutions fell by the most on record last month, a sign
capital outflows have picked up. Margin traders reduced holdings of shares purchased with borrowed money for a 4th day on Fri. The State Council, or cabinet, yesterday announced it will allow
pension funds to invest as much as 30% of total net assets
in stocks. Pension funds had net assets of 3.5T yuan ($547B) by the end of 2014. The move is the latest attempt by the gov to support the
equity market, after arming a state agency with more than $400B,
banning selling by major shareholders & telling state-owned companies
to buy stocks.
Oil prices fell 4% to fresh 6½ year lows on Mon, after
Chinese stock markets suffered their biggest one-day drop since the
global financial crisis, intensifying worries over the outlook for
global oil demand. Growing concerns of a China-led global economic slowdown sparked
sharp declines in global equities & commodities, with around €400B wiped off Europe's FTSEurofirst 300 stocks index. Brent oil was trading down $1.95, or more than 4%, at $43.51, its
weakest since Mar 2009. US light crude was down $1.83 (4.5%) at $38.62. Steep losses last week led to the
contract's longest weekly losing streak since 1986. US crude is now more than 17% below its opening price at the start of the month & Brent is down more than 16%.
This is one ugly day for the stock market. Chaos is ruling & even the expected rate increase by the Fed next month is of little interest. Dow was off more than 500 in the pre trading market & looks like it will finish with one of its worst daily losses in history. Cash is king & Treasuries along with gold see money flowing into these "safe"investments. Not much to do but await developments.


No comments:
Post a Comment