Friday, July 29, 2011

Lower markets on increased debt concerns

Stocks were weak all day with selling in the last hour.  Dow fell 96, decliners over advancers almost 2-1 & NAZ was off 9. Bank stocks were hit with selling in the last hour.

S&P 500 Financials Sector Index


Value 199.18 One-Year Chart for S&P 500 Financials Sector Index GICS Level 1 (S5FINL:IND)
Change   -0.51     (-0.3%)

MLPs pulled back from earlier highs, but the index managed a gain for the day while the REIT index was essentially even in the 248s.  Junk bond funds sold off amid the chaos in DC.  There was demand for Treasuries with the yield on the 10 year plunging below 2.8%.  Oil was under pressure but the storm in the Gulf could be a boost next week. Gold rose to a record on demand for a safe haven investment.

Alerian MLP Index


Value 362.97 One-Year Chart for Alerian MLP Index (AMZ:IND)
Change    1.56    (0.4%)

Treasury yields:


U.S. 3-month

0.092%

U.S. 2-year

0.355%

U.S. 10-year

2.792%

CLU11.NYM...Crude Oil Sep 11...95.80 ...Down 1.64  (1.7%)

Live 24 hours gold chart [Kitco Inc.]


Shares of C&J Energy Services, provider of services to the oil & natural gas industries, shot up in its market debut.  It priced 11½M shares at $29 & closed at $30.65, up $1.65.  CJES is selling 4.3M shares & shareholders are selling 7.2M.  The net proceeds of approximately $113M will be used to pay off debt & buy new equipment.  On a dismal day, it's good to see a successful offering, especially from a non technology company.

C&J Energy shares jump in their market debut AP


Photo:   Yahoo

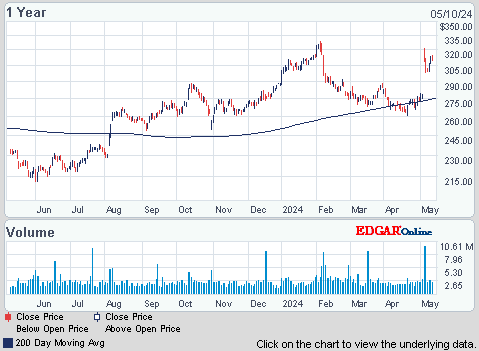
Amgen, the biotech drugmaker, reported Q2 earnings slipped 3% on increased research spending & sales costs for product launches plus falling revenue from a key drug.  But the results beat estimates & AMGN expects to reach the upper end of its guidance for 2011.  EPS was $1.25 which compares with $1.25 last year.  Adjusted EPS was $1.37, beating estimates of adjusted earnings at $1.29.  Revenue climbed 4% to $3.96B & ahead of $3.77B forecasted.  R&D costs rose 26% to $808M to pay for late-stage clinical trials. AMGN expects to reach the upper end of its 2011 guidance (EPS ranging from $5.00-$5.20) on revenue of $15.1-$15.5B.  The stock liked the news & rose 1.27 following a lackluster year.

Amgen's 2Q profit falls 3 pct on rising R&D costs AP
Amgen Inc. (AMGN)


stock chart


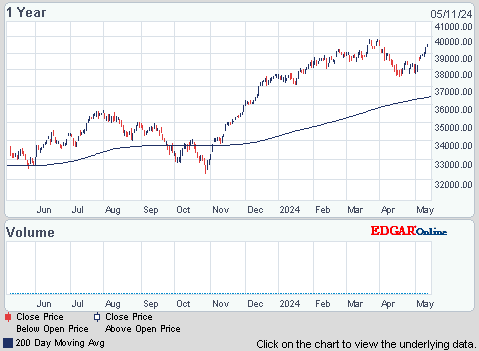
Earnings season is wrapping up.  I guess it is getting fairly good grades although I've seen a lot of misses & warnings.  But this weekend that means little.  Eyes will be on DC where votes will be taken with a lot of posturing.  But the votes may not mean a lot until Mon arrives & these guys get serious.  There is a huge amount riding on the outcome of raising the debt ceiling & how that will affect the stock markets.  At a minimum, any upward spike in interest rates will affect all securities.  Dow took all the uncertainty reasonably well, falling about 500 this week.  But next week could be a very big test.
Dow Industrials (INDU)


stock chart


Get your favorite symbols' Trend Analysis TODAY!  


Find out what's inside Trend TV  

Markets confused about raising the debt ceiling

Dos fell 39, decliners ahead of advancers 5-4 & NAZ was up 3.  After starting lower, bank stocks pushed into the black.

S&P 500 Financials Sector Index


Value 200.19 One-Year Chart for S&P 500 Financials Sector Index GICS Level 1 (S5FINL:IND)
Change    0.50     (0.2%)

The MLP index slipped fractionally to below 360 & the REIT index sloshed around the 243s.  Junk bond funds were hit with selling but Treasuries were higher on the news out of DC.  Oil fell, headed for the first weekly decline in 5, on concern of a failure to reach a deal on raising the debt limit may cause the nation to default, threatening the economy.  Gold likes uncertainty in the financial markets & rose to new records.  Just a few months ago, $1400 was a target the bulls were hoping to reach. 

JPMorgan Chase Capital XVI (AMJ)


stock chart


Get the latest market update below:


Treasury yields:


U.S. 3-month

0.081%

U.S. 2-year

0.367%

U.S. 10-year

2.847%

CLU11.NYM...Crude Oil Sep 11...95.44 ....Down 2.00  (2.1%)

GCQ11.CMX...Gold Aug 11....1,630.80 ...Up 17.40  (1.1%)


GDP climbed at a 1.3% annual rate following a 0.4% gain in Q1, less than earlier estimated, according to the Commerce Dept.  Household purchases, about 70% of the economy, rose 0.1%.  Slower job & income gains raise the risk that a pickup in purchases during the remainder of 2011 will fail to materialize. The faltering economy may get another blow from spending cuts being negotiated in Congress.


Photo:   Yahoo

Chevron, a Dow stock, said profits jumped 43% in Q2 as higher oil & gasoline prices made up for a decline in oil production.  EPS was $3.85 up from $2.70.  Revenue increased 31% to $66.7B.  Analysts had expected EPS of $3.51.  The profit was the largest since it set a company record of $7.9B in Q3 of 2008, mirroring similar big gains for other major oil companies.  US oil prices increased 46% & 51% internationally in Q2.  Natural gas prices increased 8% in the US & 25% internationally.  These increases helped boost revenue despite a decline in production.  Production was 2.69M barrels per day, down from 2.75M last year.  The company ramped up oil & gas production from new projects in Canada & the US which was offset by a decline in output from mature fields & a slowdown in its intl production business.  The stock fell 36¢. 

Chevron 2Q profit jumps 43 percent AP

Chevron Corporation (CVX)


stock chart


Newell Rubbermaid, maker of Rubbermaid plastic containers, Sharpie pens & other goods, Q2 profits climbed 13%, with strong performances in Latin America & the Asia Pacific region countering weakness in the US & Europe.  But it trimmed full-year adjusted earnings outlook because of the difficult economic conditions in the US & Europe as well as ongoing weakness in its baby & parenting segment.  EPS was 49¢, up from 41¢ last year.  Adjusted EPS fell to 46¢ from 51¢ due to increasing costs & higher selling, general & administrative spending (excluding restructuring charges & other items).  The performance missed 47¢ EPS forecasted.  Revenue rose 5% to $1.57B, slighlty below estimates of $1.59B.  NWL anticipates full-year adjusted EPS of $1.55-$1.62 per share, down from $1.60-$1.67.  The company also cut its 2011 core sales growth expectations to a range of 1-3% from a prior forecast of a 3-4% increase.  The stock rose 1.32 in what has been a tough year.

Newell Rubbermaid 2Q net income climbs AP


stock chart


The economic indicators continue on the weak side.  GDP numbers were not encouraging.  But everybody is watching DC & nobody has any idea of what will happen.  My bet is they will raise the debt ceiling, but have to wait until the last minute.  However, the AAA debt rating is very much at risk NO MATTER WHAT HAPPENS.  This weekend will not be exciting & generate gossip, not news.  Next Tues we'll have a better understanding of what was decided. There is a lot at stake because a spike in interest rates could be a major blow to the economic recovery which is already sputtering.

Dow Industrials (INDU)


stock chart


Find out what's inside Trend TV 


Get your favorite symbols' Trend Analysis TODAY!  

Thursday, July 28, 2011

Markets drift lower on increased worries over the debt debate

Stocks began the day much higher, but sold off in the PM on a realization that efforts to raise the debt ceiling are going nowhere.  Dow fell 62 (135 below the high), decliners ahead of advancers 3-2 & NAZ inched up 1.  Bank stocks, after a good gain in the AM, had to settle for break even.

S&P 500 Financials Sector Index


Value199.69One-Year Chart for S&P 500 Financials Sector Index GICS Level 1 (S5FINL:IND)
Change   0.09     (0.0%)

MLPs & REITs were flattish as were junk bond funds.  Treasuries rose, bringing the yield on the 10 year bond down to 2.95%. Oil was also even as traders waited to learn more about the possible impact of a tropical storm in the Gulf of Mexico.  Gold fell for the 2nd straight day on investor sales after the metal surged to a record.

Alerian MLP Index


Value360.41One-Year Chart for Alerian MLP Index (AMZ:IND)
Change    -0.33    (-0.1%)

Treasury yields:


U.S. 3-month

0.071%

U.S. 2-year

0.418%

U.S. 10-year

2.949%

CLU11.NYM...Crude Oil Sep 11...97.41 ...Up 0.01  (0.0%)

Live 24 hours gold chart [Kitco Inc.]


Get the latest daily market update below:


DR Horton profit fell 43% in its fiscal Q3 as the homebuilder closed on fewer homes & new home orders declined.  But earnings beat estimates & management said the company is in position to be profitable for FY2011.  Closings fell 33% in Q3 from a year earlier, while its new home orders slipped about 1%. The sales results were roughly in line with forecasts for a 31% drop in closings & no change in the level of orders.  EPS was 9¢ versus 16¢ last year.  The latest results included $16.4M in pretax charges & losses from paying debt off early.  Revenue dropped 30% to $975M from $1.4B.  Analysts were expecting a profit of 5¢ on $985M in revenue.  The stock rose 30¢.

D.R. Horton’s Profit Leads Homebuilder Rally

D.R. Horton, Inc. (DHI)


stock chart


Photo:   Yahoo

Exxon Mobil, a Dividend Aristocrat, profits rose 41% in Q2, when the price of gasoline & other fuels jumped to 3-year highs.  Its Q2 income of $10.6B is the largest since it set a net income record of $14.8B in Q3 of 2008.  But XOM sounded a cautionary note, saying sluggish business investment, lower consumer spending & high debt continue to weigh on energy demand.  EPS was $2.18, sharply ahead of  $1.60 last year.  Revenue grew 36% to $125.5B.  However results fell short of estimates for $2.30 for EPS & revenue topped projections of $119B.  The stock fell 1.85 after trading flattish in 2011.

Exxon Misses Estimates on Lower Refining Profits

Exxon Mobil Corporation (XOM)


stock chart


Greek officials launched talks with intl bankers on details of a complex plan to restructure the loan-dependent country's privately held debt under a new bailout deal.  Evangelos Venizelos, Finance Minister, said the negotiations started "in a most encouraging manner."  We have started (the talks) and will conclude very soon because we face specific bonds maturing in Aug & Sep and want either to have finished before that or to have formulated a transitional framework until we have finished," Venizelos told parliament. What else can he say?  This agreement called for banks, pension funds & other private institutions holding Greek debt to voluntarily swap their bonds for new ones with lower interest rates or slightly smaller face value.  Provided overall private sector participation meets a targeted 90%, the swap will involve €135B worth of bonds that mature by the end of 2020, with bondholders taking a 21% loss.  This is a variation on default!

Greek FM: Athens bond swap talks 'encouraging' AP


Senator Harry Reid said he will move tonight to kill the House debt-ceiling plan, paving the way for Senate votes this weekend on a possible compromise to avert a potential US default.  Who knows where this is all going?  Chances are the politicos will come up with some temporary kind of funding bill to allow the Treasury to squeak by the Aug deadline & avoid default.  But don't expect a final bill over the weekend.  A bigger question is, how will the rating agencies take the increase in the debt ceiling?  Everybody is slopping around billions as if they were just small poker chips.  Sadly few really understand numbers.  But Dow has been handling all this confusion very well, down only 500 from its recent highs.  Not that bad considering how much is at stake! 

Dow Industrials (INDU)


stock chart  


Get your favorite symbols' Trend Analysis TODAY!  


Find out what's inside Trend TV  

Higher markets on lower jobless claims

Dow rose 77, advancers over decliners 2-1 & NAZ gained 33.  Once again, bank stocks were market leaders.

S&P 500 Financials Sector Index


Value 201.91 One-Year Chart for S&P 500 Financials Sector Index GICS Level 1 (S5FINL:IND)
Change    2.31     (1.2%)

The MLP index rose 2 to the 362s & the REIT index was up 2+ to the 245s.  Junk bond funds were slightly higher (near their 2011 highs) & Treasuries were stronger bringing the yield on the 10 year Treasury below 3%.  Oil fluctuated, not sure what to do, & gold slipped off its record highs.

JPMorgan Chase Capital XVI (AMJ)


stock chart


The latest daily market update below:


Treasury yields:


U.S. 3-month

0.076%

U.S. 2-year

0.414%

U.S. 10-year

2.951%

CLU11.NYM...Crude Oil Sep 11...97.58 ....Up 0.18  (0.2%)

GCQ11.CMX...Gold Aug 11....1,607.00 ...Down 8.10  (0.5%)


Photo:  Yahoo

The number of people seeking unemployment benefits dropped last week to the lowest level in more than 3 months, a sign the job market may be healing after a recent slump.  The Labor Dept reported that applications fell 24K to 398K, the first time applications have fallen below 400K in 16 weeks.  The 4-week average dropped to 413K,, the lowest since early Apr. Some of the drop likely reflects seasonal volatility. Applications were elevated earlier this month partly because of temporary layoffs in the auto & other manufacturing industries, which are ending.  Many auto companies close their factories in early Jul to prepare for new models.  The number seeking unemployment benefits remains higher than would be expected in a healthy economy.  The total number receiving unemployment benefits, meanwhile, dipped to 3.7M, that doesn't include millions receiving extended benefits under emergency programs enacted during the recession. All told, 7.65M people received benefits.  Some good news on the jobs front.

Jobless Claims in U.S. Decreased to Three-Month Low


Existing home sales were up 2% in Jun as housing is still stuck in its long term slump.  The jobless report was encouraging, but it will take more weekly reports to indicate that the Q2 slump has ended.  Center stage remains in DC.  There will be plenty of posturing & little be decided before Mon evening.  Chances are great that there will be no default, although some Reps are talking very tough.  But a credit downgrade to AA is a fair bet & that will bring turmoil in the markets for the short term at a minimum.  The Greek debt problem (one way or the other) will also have to be resolved shortly

Dow Industrials (INDU)


stock chart


Find out what's inside Trend TV  


Get your favorite symbols' Trend Analysis TODAY!