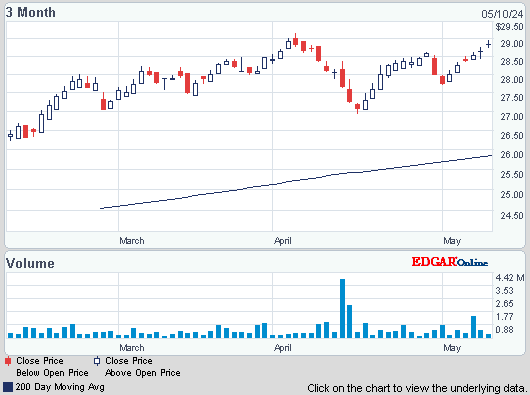
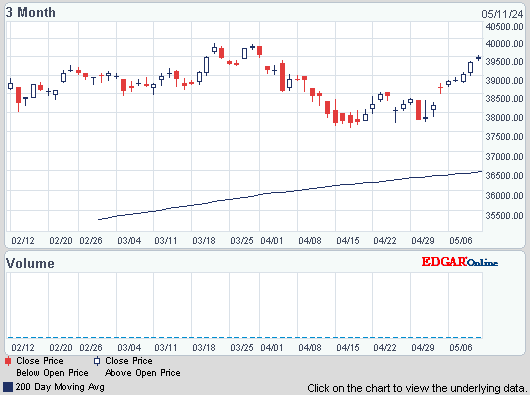
Dow dropped 51, decliners over advancers 2-1 & NAZ lost 20. The Financial Index fell 1+ to 236 (5 below its highs made this week). The MLP index fell 5 (a very big daily drop) to the 426s & the REIT index was off 1 to the 278s. Following the stock market decline, junk bond funds were lower & Treasuries rose, taking the yield on the 10 year Treasury back below 2%. Oil sank to a 1 month low & gold was little changed at depressed levels.
AMJ (Alerian MLP Index tracking fund)


Photo: Bloomberg
The number seeking unemployment benefits jumped 20K last week to 362K, though it remains at a level that suggests slow but steady improvement in the job market. The Labor Dept said that the 4-week average rose 8K to 360K, the highest in 6 weeks. Applications for unemployment benefits are a proxy for layoffs. Even with last week's jump, they have trended downward recently. The 4-week average has declined 7.5% since mid-Nov & fell to a 5-year low 3 weeks ago. Employers added an average of 200K jobs a month from Nov thru Jan, up from about 150K in the previous 3 months. Last week's increase puts applications back in the 360-390K range, where they have fluctuated since early last year. Since then, employers have added an average of 181K jobs a month. 5.6M received unemployment benefits, about 300K fewer than in the previous week. Some of those no longer receiving unemployment aid may now be employed, but many others have exhausted the benefits available to them.
Claims for US jobless aid suggest modest hiring AP

Photo: Bloomberg
Sales of previously owned homes in the US increased in Jan, showing more momentum for the industry coming off its best year since 2007. Purchases of existing houses increased 0.4% to a 4.92M annual rate, according to the National Association of Realtors (matching the forecast). The number of available properties slumped to the lowest level since 1999. A sustained pickup in housing will depend on faster progress in the labor market, fewer foreclosures & easier access to credit. Today’s report includes the Realtors group’s annual revisions to sales and months’ supply data from 2010 thru 2012. Some 4.66M previously owned houses were sold last year, the most since 2007. The market peaked at a record 7.08M in 2005. Resales accounted for about 93% of the residential market in 2012.
Previously Owned U.S. Home Sales Climb to 4.92 Million
Wal-Mart, a Dow stock & Dividend Aristocrat, offered a weak business outlook as new economic challenges for its low-income shoppers start to take a toll. It reported an 8.6% increase in profit for the Q4 which includes the crucial holiday season. But higher gasoline prices, late tax refunds & the payroll tax increase have it wary about the coming year. These latest results, which cover the 3 months that ended Jan 31, show that gas prices & the payroll tax increase of 2 percentage points are shrinking the little disposable income many of the chain's customers have. The company said that after a strong start to the holiday season, the first 3 weeks of Dec were weak, & business has been volatile since then. WMT acknowledged that Feb started "slower than planned" but noted that it was largely due to the delay in tax refund checks. For the current qtr, WMT expects revenue at US stores open at least a year to be flat with last year, a slowdown from the 1% increase in Q4. EPS was $1.67, up from $1.50 a year earlier. Net sales rose 3.9% to $127B. EPS topped estimates of $1.57, but sales fell short of the $127.8B estimate. The company expects EPS of $1.11-$1.16 for Q1, below the $1.18 forecast. For 2013, WMT expects EPS of $5.20-$5.40 & analysts expect $5.38. The quarterly div was raised 18% to 47¢. Investors liked the news, taking the stock 1.87 higher following weakness in Feb.
While stocks are having a bad day, it's not terrible. Dow is at the low end of its trading range in Feb. If sellers take it below 13850 (& it's very near right now), that would be a short term bearish signal. The news has been pretty much as expected, but a lack of really good news has the bulls nervous. Now the Mar 1 deadline for mandatory federal budget cuts is closer & getting more attention. Keep in mind budget cuts don't really mean less money. The idea is that instead of growing 10%, spending growth will be cut to 5%. Massive budget deficits will continue unless congress gets serious & that will require painful decisions that will hurt the recovery. The stock market is back on defense.
Dow Jones Industrials

AMJ (Alerian MLP Index tracking fund)
Treasury yields:
U.S. 3-month |
0.119% | |
U.S. 2-year |
0.248% | |
U.S. 10-year |
1.969% |
| CLJ13.NYM | ....Crude Oil Apr 13 | ...93.04 | ... | (2.3%) |
| GCG13.CMX | ...Gold Feb 13 | .....1,575.70 | ... | (0.1%) |

Photo: Bloomberg
The number seeking unemployment benefits jumped 20K last week to 362K, though it remains at a level that suggests slow but steady improvement in the job market. The Labor Dept said that the 4-week average rose 8K to 360K, the highest in 6 weeks. Applications for unemployment benefits are a proxy for layoffs. Even with last week's jump, they have trended downward recently. The 4-week average has declined 7.5% since mid-Nov & fell to a 5-year low 3 weeks ago. Employers added an average of 200K jobs a month from Nov thru Jan, up from about 150K in the previous 3 months. Last week's increase puts applications back in the 360-390K range, where they have fluctuated since early last year. Since then, employers have added an average of 181K jobs a month. 5.6M received unemployment benefits, about 300K fewer than in the previous week. Some of those no longer receiving unemployment aid may now be employed, but many others have exhausted the benefits available to them.
Claims for US jobless aid suggest modest hiring AP

Photo: Bloomberg
Sales of previously owned homes in the US increased in Jan, showing more momentum for the industry coming off its best year since 2007. Purchases of existing houses increased 0.4% to a 4.92M annual rate, according to the National Association of Realtors (matching the forecast). The number of available properties slumped to the lowest level since 1999. A sustained pickup in housing will depend on faster progress in the labor market, fewer foreclosures & easier access to credit. Today’s report includes the Realtors group’s annual revisions to sales and months’ supply data from 2010 thru 2012. Some 4.66M previously owned houses were sold last year, the most since 2007. The market peaked at a record 7.08M in 2005. Resales accounted for about 93% of the residential market in 2012.
Previously Owned U.S. Home Sales Climb to 4.92 Million
Wal-Mart, a Dow stock & Dividend Aristocrat, offered a weak business outlook as new economic challenges for its low-income shoppers start to take a toll. It reported an 8.6% increase in profit for the Q4 which includes the crucial holiday season. But higher gasoline prices, late tax refunds & the payroll tax increase have it wary about the coming year. These latest results, which cover the 3 months that ended Jan 31, show that gas prices & the payroll tax increase of 2 percentage points are shrinking the little disposable income many of the chain's customers have. The company said that after a strong start to the holiday season, the first 3 weeks of Dec were weak, & business has been volatile since then. WMT acknowledged that Feb started "slower than planned" but noted that it was largely due to the delay in tax refund checks. For the current qtr, WMT expects revenue at US stores open at least a year to be flat with last year, a slowdown from the 1% increase in Q4. EPS was $1.67, up from $1.50 a year earlier. Net sales rose 3.9% to $127B. EPS topped estimates of $1.57, but sales fell short of the $127.8B estimate. The company expects EPS of $1.11-$1.16 for Q1, below the $1.18 forecast. For 2013, WMT expects EPS of $5.20-$5.40 & analysts expect $5.38. The quarterly div was raised 18% to 47¢. Investors liked the news, taking the stock 1.87 higher following weakness in Feb.
While stocks are having a bad day, it's not terrible. Dow is at the low end of its trading range in Feb. If sellers take it below 13850 (& it's very near right now), that would be a short term bearish signal. The news has been pretty much as expected, but a lack of really good news has the bulls nervous. Now the Mar 1 deadline for mandatory federal budget cuts is closer & getting more attention. Keep in mind budget cuts don't really mean less money. The idea is that instead of growing 10%, spending growth will be cut to 5%. Massive budget deficits will continue unless congress gets serious & that will require painful decisions that will hurt the recovery. The stock market is back on defense.
Dow Jones Industrials


No comments:
Post a Comment