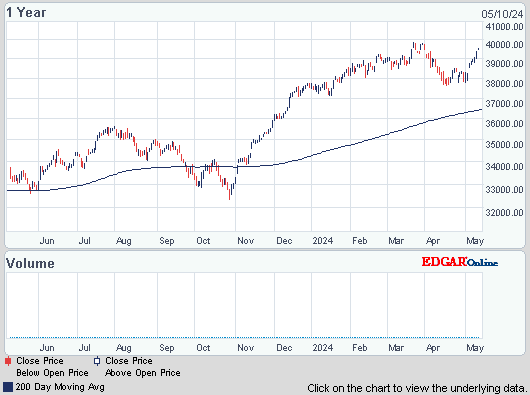
Dow fell 135 (closing near the lows) from its record high close in 2013, decliners over advancers more than 2-1 & NAZ was off 33. The MLP index dropped 5+ to the 458s & the REIT index fractionally lower to the 264s. Junk bond funds slid back & Treasuries rose, taking the yield on the 10 year Treasury back below 3%. Oil fell sharply after a good run in Dec & gold had a modest recovering following last year's terrible decline
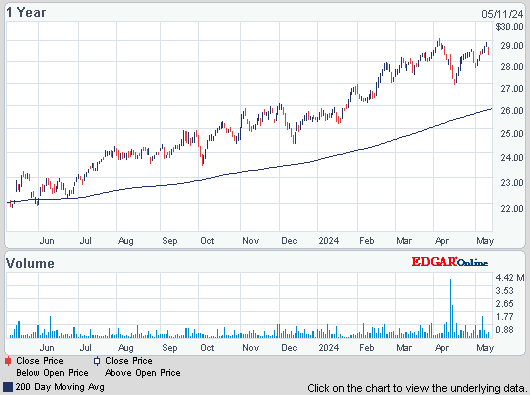
AMJ (Alerian MLP Index tracking fund)

![Live 24 hours gold chart [Kitco Inc.]](http://www.kitco.com/images/live/gold.gif)

Photo: Bloomberg
Chinese manufacturing indices fell in Dec, underscoring challenges for Pres Xi Jinping as he tries to sustain growth while rolling out reforms. The Purchasing Mangers' Index from HSBC Holdings & Markit Economics fell to 50.5 from 50.8 in the previous month. A separate gauge compiled by the statistics bureau & logistics federation released yesterday declined to 51 from 51.4. Swelling local-gov debt, surging property prices in some cities & volatility in money-market rates are risks as Xi embarks on reforms intended to lay the foundation for more sustainable long-term growth. GDP may have risen 7.6% in 2013, the slowest pace in 14 years. While that would exceed the gov 7.5% target, it would also be the slowest pace since 1999 when the gain was 7.6%. Expansion may fall to 7.4% this year. Today’s reading was the weakest in 3 months & was the same as the preliminary number released 2 weeks ago. The official PMI released yesterday slipped to a 4 month low & trailed the 51.2. Gauges of output & new orders rose at a weaker rate in the HSBC & official PMIs. Both surveys showed new export orders dropped below the 50 mark that separates expansion from contraction & the employment measure in the statistics bureau’s index fell to the weakest reading since Jun. A strong Chinese economy is facing headwinds.
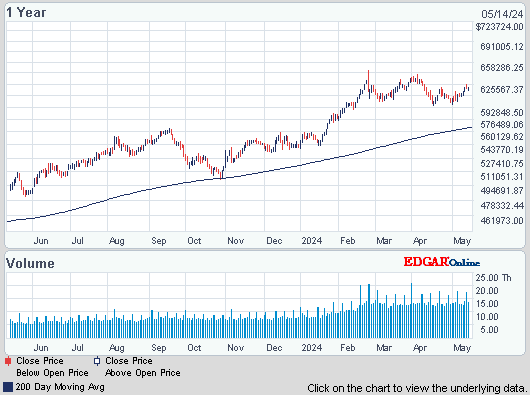
Warren Buffett probably missed his target for the first time in 44 years. Berkshire Hathaway is poised to report that it failed to increase net worth more rapidly than the S&P 500 during the past 5 years. It would be the first time he fell short of the goal since he took over the company in 1965. He highlights the comparison as a way for shareholders to evaluate his performance against a low-cost fund that tracks the index. The S&P 500 returned 128% including divs since the end of 2008 (recession lows), fueled by the Federal Reserve’s stimulus efforts & higher corp profits. BRK.A book value per share rose 80% to almost $127K starting at the same point until Sep 30, the latest data available. Buffett has said that if he’s able to add value more quickly than the S&P 500 rises, BRK.A shares should outperform the benchmark over time. Buffett’s long-term track record is among the best in investing & responsible for making many of his early backers wealthy. Book value stood at just $19 a share when he took over & had compounded at almost 20% annually thru 2012 beating the 9.4% for the benchmark. The stock lost $1580 today, but has had a good run in the last year.
Berkshire Converts USG Notes Into Stock as Buffett Gains from 2008 Wager

Stocks took a breather after an outstanding performance last year. It's hard to take too much away from the decline when some traders have not returned & there was minimal economic data. Auto sales are coming shortly & they should be positive. The big Dec jobs report (along with the unemployment rate) will be reported a week from tomorrow & that should also be favorable. Any weakness would be seen as a plus, giving the Federal Reserve less courage to decrease its monthly bond purchases. On the other hand, the first day, first week & first month are traditionally viewed as signals for the entire year. Take your pick which one to follow.
Dow Jones Industrials

AMJ (Alerian MLP Index tracking fund)
Treasury yields:
U.S. 3-month |
0.06% | |
U.S. 2-year |
0.38% | |
U.S. 10-year |
2.98% |
| CLG14.NYM | ....Crude Oil Feb 14 | ....95.48 | (3.0%) |
![Live 24 hours gold chart [Kitco Inc.]](http://www.kitco.com/images/live/gold.gif)

Photo: Bloomberg
Chinese manufacturing indices fell in Dec, underscoring challenges for Pres Xi Jinping as he tries to sustain growth while rolling out reforms. The Purchasing Mangers' Index from HSBC Holdings & Markit Economics fell to 50.5 from 50.8 in the previous month. A separate gauge compiled by the statistics bureau & logistics federation released yesterday declined to 51 from 51.4. Swelling local-gov debt, surging property prices in some cities & volatility in money-market rates are risks as Xi embarks on reforms intended to lay the foundation for more sustainable long-term growth. GDP may have risen 7.6% in 2013, the slowest pace in 14 years. While that would exceed the gov 7.5% target, it would also be the slowest pace since 1999 when the gain was 7.6%. Expansion may fall to 7.4% this year. Today’s reading was the weakest in 3 months & was the same as the preliminary number released 2 weeks ago. The official PMI released yesterday slipped to a 4 month low & trailed the 51.2. Gauges of output & new orders rose at a weaker rate in the HSBC & official PMIs. Both surveys showed new export orders dropped below the 50 mark that separates expansion from contraction & the employment measure in the statistics bureau’s index fell to the weakest reading since Jun. A strong Chinese economy is facing headwinds.
Warren Buffett probably missed his target for the first time in 44 years. Berkshire Hathaway is poised to report that it failed to increase net worth more rapidly than the S&P 500 during the past 5 years. It would be the first time he fell short of the goal since he took over the company in 1965. He highlights the comparison as a way for shareholders to evaluate his performance against a low-cost fund that tracks the index. The S&P 500 returned 128% including divs since the end of 2008 (recession lows), fueled by the Federal Reserve’s stimulus efforts & higher corp profits. BRK.A book value per share rose 80% to almost $127K starting at the same point until Sep 30, the latest data available. Buffett has said that if he’s able to add value more quickly than the S&P 500 rises, BRK.A shares should outperform the benchmark over time. Buffett’s long-term track record is among the best in investing & responsible for making many of his early backers wealthy. Book value stood at just $19 a share when he took over & had compounded at almost 20% annually thru 2012 beating the 9.4% for the benchmark. The stock lost $1580 today, but has had a good run in the last year.
Berkshire Converts USG Notes Into Stock as Buffett Gains from 2008 Wager
Berkshire Hathaway (BRK.A)
Stocks took a breather after an outstanding performance last year. It's hard to take too much away from the decline when some traders have not returned & there was minimal economic data. Auto sales are coming shortly & they should be positive. The big Dec jobs report (along with the unemployment rate) will be reported a week from tomorrow & that should also be favorable. Any weakness would be seen as a plus, giving the Federal Reserve less courage to decrease its monthly bond purchases. On the other hand, the first day, first week & first month are traditionally viewed as signals for the entire year. Take your pick which one to follow.
Dow Jones Industrials
I’m a huge fan of INO & from what I have seen so far, their service Marketclub! This isn’t a stripped down version, everything in MarketClub is available to you. I don’t want to give everything away, but you’ll have unlimited access to my favorite 3 tools: Trade Triangles, Smart Scan & Alerts! The best part is that the MarketClub customer support team will be providing UNLIMITED support!
You can call or email for an instant response to any question, comment or concern.
Here’s that link:
https://club.ino.com/join/specialtrial/index_free.html?a_aid=CD3289&a_bid=359ef9a3
I’d recommend you jump on this now.


No comments:
Post a Comment