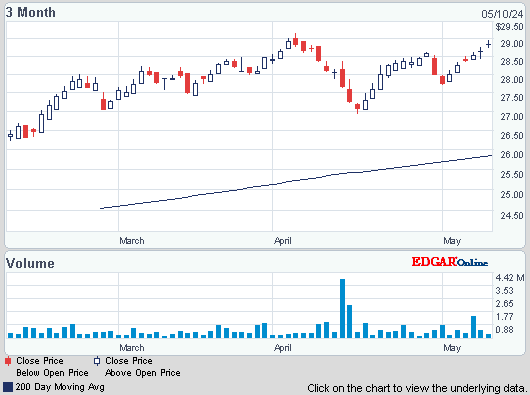
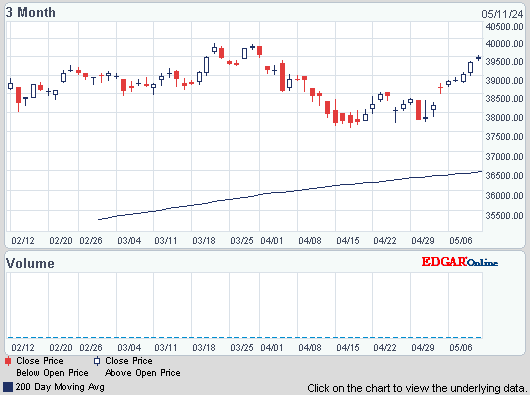
Dow rose 89, advancers over decliners 3-1 & NAZ was up 57. The MLP index jumped almost 4 to 460 (after trading sideways for months) & the REIT index added 3+ to272. Junk bond funds gained & Treasuries pulled back. Oil found buyers while gold fell.
AMJ (Alerian MLP Index tracking fund)

Contracts to purchase previously owned homes in the US plunged in Dec by the most since May 2010 as higher borrowing costs & bad weather held back sales. A gauge of pending home sales slumped 8.7% after a revised 0.3% drop in Nov that was initially reported as a gain, according to the National Association of Realtors. The projection called for the index to drop 0.3%. Tight inventory & unusually cold weather discouraged prospective buyers. Further gains in hiring, household wealth & consume confidence would help boost the housing recovery and the economy. Contract signings dropped 6.1% from the year prior on an unadjusted basis after a 4.4% decrease in the 12 months that ended in Nov. The pending sales index was 92.4 (a reading of 100 corresponds to the average level of contract activity in 2001, or “historically healthy” home-buying traffic). All 4 regions showed a decrease from Nov, led by a 10.3% slump in Northeast. Pending sales are considered a leading indicator because they track new purchase contracts. “Unusually disruptive weather across large stretches of the country in December force people indoors and prevented some buyers from looking at homes or making offers,” NAR chief economist Lawrence Yun said.
Pending Sales of U.S. Existing Homes Slump Most Since 2010
Applications for unemployment benefits in the US rose more than forecast last week to the highest level in more than a month, partly reversing a post-holiday slump. Jobless claims climbed 19,K to 348K last week which included the Martin Luther King holiday, according to the Labor Dept, The reading was the highest since mid-Dec & the forecast projected 330K. The 4 week average of claims increased to 333K from 332K in the prior week. The number continuing to receive jobless benefits fell 16K to 2.99M in last week. Emergency benefits expired for the unemployed after Congress allowed the program to lapse at the end of 2013. The extended benefits were stopped in the week ended Dec 28.
Jobless Claims in U.S. Climbed More Than Forecast Last Week
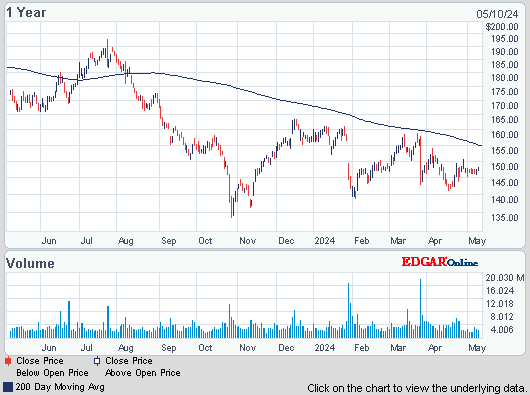
UPS Q4 profit dropped 8.5% as a late surge in online Christmas shopping snarled operations & led to missed deliveries that boosted costs. EPS was $1.25, down from adjusted EPS of $1.32 a year earlier. Analysts had estimated $1.43 before UPS gave preliminary results on Jan 17. The company expects full-year EPS of $5.05-$5.30, an increase of 11-16% over 2013 adjusted results. UPS had to hire 85K temp workers (55% more than its original plan) when the last-minute deluge of air shipments exceeded the processing capacity of its system. “The increased volume put a strain on our network, causing delays,” CEO Scott Davis said. “In response, UPS deployed additional people and equipment, placing a greater emphasis on service than cost. UPS will make the necessary investments and operational improvements to ensure we meet the needs of the marketplace.” Sales rose 2.8% to $14.98B, falling short of the $15.18B expected.
Q4-2012 included $3B in one-time costs for an increase in pension expenses. The stock went up 1.04.
If you would like to learn more about UPS, click on this link:
club.ino.com/trend/analysis/stock/UPS?a_aid=CD3289&a_bid=6ae5b6f7
UPS Quarterly Profit Falls 8.5% After Snags in Christmas-Season Shipping

Who knows what's behind this rally. Maybe shorts are covering their positions before the month's end which always has the potential for being volatile. With earnings season winding down, there was no special news today. Those guys in DC still have to raise the debt ceiling in a couple of weeks, not to mention other fiscal problems which are pending. Dow remains down more than 750 in Jan, one of its worst months in some time!
Dow Jones Industrials

AMJ (Alerian MLP Index tracking fund)
Treasury yields:
U.S. 3-month |
0.02% | |
U.S. 2-year |
0.35% | |
U.S. 10-year |
2.70% |
| CLH14.NYM | ...Crude Oil Mar 14 | ...98.43 | (1.1%) |
| GCG14.CMX | ...Gold Feb 14 | .....1,242.70 | (1.5%) |
Contracts to purchase previously owned homes in the US plunged in Dec by the most since May 2010 as higher borrowing costs & bad weather held back sales. A gauge of pending home sales slumped 8.7% after a revised 0.3% drop in Nov that was initially reported as a gain, according to the National Association of Realtors. The projection called for the index to drop 0.3%. Tight inventory & unusually cold weather discouraged prospective buyers. Further gains in hiring, household wealth & consume confidence would help boost the housing recovery and the economy. Contract signings dropped 6.1% from the year prior on an unadjusted basis after a 4.4% decrease in the 12 months that ended in Nov. The pending sales index was 92.4 (a reading of 100 corresponds to the average level of contract activity in 2001, or “historically healthy” home-buying traffic). All 4 regions showed a decrease from Nov, led by a 10.3% slump in Northeast. Pending sales are considered a leading indicator because they track new purchase contracts. “Unusually disruptive weather across large stretches of the country in December force people indoors and prevented some buyers from looking at homes or making offers,” NAR chief economist Lawrence Yun said.
Pending Sales of U.S. Existing Homes Slump Most Since 2010
Applications for unemployment benefits in the US rose more than forecast last week to the highest level in more than a month, partly reversing a post-holiday slump. Jobless claims climbed 19,K to 348K last week which included the Martin Luther King holiday, according to the Labor Dept, The reading was the highest since mid-Dec & the forecast projected 330K. The 4 week average of claims increased to 333K from 332K in the prior week. The number continuing to receive jobless benefits fell 16K to 2.99M in last week. Emergency benefits expired for the unemployed after Congress allowed the program to lapse at the end of 2013. The extended benefits were stopped in the week ended Dec 28.
Jobless Claims in U.S. Climbed More Than Forecast Last Week
UPS Q4 profit dropped 8.5% as a late surge in online Christmas shopping snarled operations & led to missed deliveries that boosted costs. EPS was $1.25, down from adjusted EPS of $1.32 a year earlier. Analysts had estimated $1.43 before UPS gave preliminary results on Jan 17. The company expects full-year EPS of $5.05-$5.30, an increase of 11-16% over 2013 adjusted results. UPS had to hire 85K temp workers (55% more than its original plan) when the last-minute deluge of air shipments exceeded the processing capacity of its system. “The increased volume put a strain on our network, causing delays,” CEO Scott Davis said. “In response, UPS deployed additional people and equipment, placing a greater emphasis on service than cost. UPS will make the necessary investments and operational improvements to ensure we meet the needs of the marketplace.” Sales rose 2.8% to $14.98B, falling short of the $15.18B expected.
Q4-2012 included $3B in one-time costs for an increase in pension expenses. The stock went up 1.04.
If you would like to learn more about UPS, click on this link:
club.ino.com/trend/analysis/stock/UPS?a_aid=CD3289&a_bid=6ae5b6f7
UPS Quarterly Profit Falls 8.5% After Snags in Christmas-Season Shipping
United Parcel Service (UPS)
Who knows what's behind this rally. Maybe shorts are covering their positions before the month's end which always has the potential for being volatile. With earnings season winding down, there was no special news today. Those guys in DC still have to raise the debt ceiling in a couple of weeks, not to mention other fiscal problems which are pending. Dow remains down more than 750 in Jan, one of its worst months in some time!
Dow Jones Industrials


No comments:
Post a Comment