

S&P 500 FINANCIALS INDEX
| Value | 205.48 | |
| Change | -0.51 (-0.3%) |
The Alerian MLP Index fell 1+ to the 361s & has been stuck in a rut for a month after plunging on scare about losing its tax preferred status. The REIT was up a fraction in the 241s & junk bond funds slipped modestly. Treasuries were strong on weak jobs data, taking the yield on the 10 year Treasury below 3%.. Oil fell, heading for the biggest weekly loss in a month, as the US jobless rate climbed, increasing concern about a slower economic recovery. Gold rebounded on speculation that the Federal Reserve will keep interest rates low to stimulate the economy, boosting the appeal of the precious metal.
JPMorgan Chase Capital XVI (AMJ)
Treasury yields:
U.S. 3-month | 0.036% | |
U.S. 2-year | 0.429% | |
U.S. 10-year | 2.982% |
| CLN11.NYM | ....Crude Oil Jul 11 | ...99.72 | ... |
| GCM11.CMX | ...Gold Jun 11 | .....1,539.50 | ... | (0.6%) |
Photo: Bloomberg
Last month was dismal on the jobs front. Payrolls increased by a less-than-projected 54K, after a revised 232K gain in Apr. The median forecast called a rise of 165K. The unemployment rate climbed to 9.1%, the highest level this year & worst than forecasts of 8.9%. Factories cut payrolls the first time in 7 months, partly reflecting a drop at motor vehicles & parts producers that may have been related to a components shortage after the earthquake in Japan. Employment at retailers, leisure-hospitality companies & state and local govs also decreased. Private hiring, excluding gov agencies, rose 83K, far below a rise of 170K estimated. Private payrolls increased 251K in Apr (initially reported as a gain of 268K). Factory payrolls decreased by 5K, compared with a forecast of a 10K increase & following a 24K gain in Apr. Employment at service-providers increased 51K & gov payrolls decreased 29K, reflecting reduced employment at the state & local level. This report qualifies as dismal, far worse then thought yesterday
U.S. Payrolls Rose Less-Than-Estimated 54,000 in May; Jobless Rate Is 9.1%
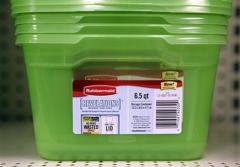
Photo: Yahoo
Newell Rubbermaid cut its full-year earnings & sales forecast, citing meager consumer spending & a lackluster economy. The maker of storage bins & Sharpie pens also says that Q2 results will be worse than expected. NWL expects normalized earnings growth of 5-10%, or EPS of $1.60-$1.67, with core sales climbing 3-4%. Its prior outlook called for normalized earnings to rise 10-12%, with core sales climbing 4-5% & analysts expected EPS of $1.69. The stock fell a very big $2 to $15, visible in its 1 year chart.
Newell Rubbermaid Tumbles After 2011 Outlook Cut on Less Consumer Spending
Newell Rubbermaid Inc. (NWL)
Wal-Mart, a Dow stock & Dividend Aristocratic, unveiled a $15B share buyback program to reassure shareholders that it's still growing. The buyback will replace a previous $15B plan begun a year ago, under which the company bought back 244M shares worth $12.9B. "This reflects the strong financial performance of your corporation," said CFO Charles Holley said. This comes after WMT already increased div to $1.46 from $1.21. While intl sales are doing well, the company is still trying to reverse a 2-year sales slump at home, with no clear sign of when that will happen. "We made a lot of progress over the last 11 months," said Bill Simon, CEO of the US business. "We have the right plan." He noted that 2/3 of the business has seen gains in a key measure of sales, most of which is coming from groceries, but cautioned, "You certainly can't predict the weather and the economy." The stock was up 11¢.
Wal-Mart Approves $15 Billion Buyback Program as Profit Growth Accelerates
Wal-Mart Stores, Inc. (WMT)
This will be the 5 consecutive weekly loss for the Dow & the short term chart below looks bad. Dow is down about 650 in May-Jun. There is one sign after another that the economy has lost the zest it had earlier in the year. The end QE2 at the Federal Reserve is approaching, that's also weighing on the markets. A Greek bailout II remains fuzzy. Markets will probably continue sliding into the weekend & an early call for next week is not encouraging.
Dow Industrials (INDU)
Get your favorite symbols' Trend Analysis TODAY!
Global Strategy Portfolio/Diversification Doesn't Work.
Free Pass To Trend TV!
Find out what's inside Trend TV
No comments:
Post a Comment