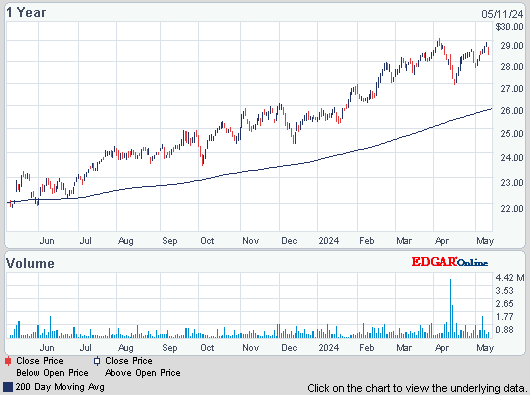
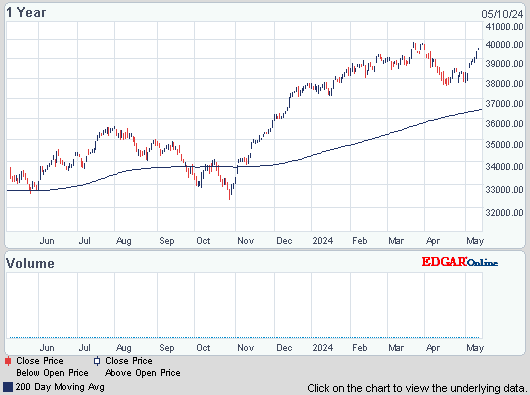
Dow's advance was trimmed to only 34, advancers over decliners 5-4 & NAZ fell 13, hurt by an almost $15 drop at high flying Apple (AAPL). The Financial Index was fractionally lower, after AM gains. The MLP index rose 2 to the 413s, a new record, & the REIT index was fractionally higher in the 262s. Junk bond funds rose along with the rising stock market but Treasuries pulled back. Oil dropped on worries about oversupply. Gold fell from the highest in
almost 11 months after the US unemployment rate unexpectedly
dropped, easing pressure on the Federal Reserve to expand
monetary stimulus.

![Live 24 hours gold chart [Kitco Inc.]](http://www.kitco.com/images/live/gold.gif)


Photo: Bloomberg
US consumer credit rose more than forecast in Aug, propelled by a surge in borrowing for education & automobiles. The $18.1B rise the most in 3 months, followed a revised $2.5B decrease in Jul, according to the Federal Reserve (FED). The forecast called for a $7¼B increase. The pickup in non-revolving borrowing, which includes student & automobile loans, was accompanied by the first gain in revolving credit in 3 months. Consumers took advantage of declining interest rates to buy vehicles, while higher gasoline prices helped push up the value of their credit-card borrowing. At the same time, job gains may be giving households enough confidence to spend. Non-revolving debt, such as that for college tuition & the purchase of vehicles & mobile homes, rose $13.9B. Demand for automobiles remains an area of strength for the economy. Banks are charging consumers the lowest interest rates on new-car loans since the FED began surveying them in 1971.
U.S. Consumer Credit Jumps $18.12 Billion in August, Fed Says
The federal gov logged a $1.1T deficit in FY2012, the 4th straight year of trillion-dollar shortfalls. As a share of the economy, the deficit fell to roughly 7%, according to Congressional Budget Office (CBO), down from 8.7% in 2011 & well below 10.1% recorded in 2009 during the depth of the economic downturn. Deficits as a share of GDP in the past 4 years have been the highest since 1947. The decline is largely due to an uptick in revenue. Compared to last year, the federal gov collected 6% more in fiscal 2012, which ended Sep 30. A big reason was the jump in corp tax receipts, which rose a whopping 34%. CBO attributes the increase in large part to a change in tax rules, particularly those that govern how fast companies can write off equipment costs. Individual income tax &payroll tax receipts were also higher, by 3% & 4% respectively. Spending, meanwhile, fell 2%. That decline, however, is due mostly to shifts in the timing of payments. Outlays for Medicaid, unemployment benefits, defense & education programs all fell. Meanwhile, Social Security outlays rose 6%, more than in recent years. Money spent on Medicare increased more slowly than in the preview 2 years, rising 3%. Overall, the 2012 deficit pushed the debt held by the public to another record high. Public debt, $11.3T, almost 73% of GDP, up from 67.7% a year ago. Total national debt, which includes money the Treasury Dept owes to gov trust funds, now tops $16T.
U.S. Deficit Tops $1 Trillion for 4th Year in a Row
Gas at the pump continues high. Crude oil has settled back from nearly $100 three weeks ago. But more disruptions, like the refinery fires, can bring even higher prices. The high for 2012 was $3.93 & the record high 4 years ago was $4.11. High priced gas is not good for the economy.


 Source: AAA
Markets saw selling in the PM. This unemployment report should have given the Dow a gain of at least 200 with good breadth in the markets. The 7.8% number doesn't tell the whole story. Jobs created was drab which has been the case for 6 months. Now that this report is out of the way, the focus will be on earnings. Alcoa (AA), a Dow stock, starts earnings season on Tues. Analysts are looking for EPS of a penny, down from 15¢ last year. This could be a tough earnings season.

AMJ (Aleiran MLP Index tracking fund)
Click below for the latest market update:
Treasury yields:
U.S. 3-month |
0.101% | |
U.S. 2-year |
0.258% | |
U.S. 10-year |
1.733% |
| CLX12.NYM | ...Crude Oil Nov 12 | ...89.85 | ... | (2.0%) |
![Live 24 hours gold chart [Kitco Inc.]](http://www.kitco.com/images/live/gold.gif)


US consumer credit rose more than forecast in Aug, propelled by a surge in borrowing for education & automobiles. The $18.1B rise the most in 3 months, followed a revised $2.5B decrease in Jul, according to the Federal Reserve (FED). The forecast called for a $7¼B increase. The pickup in non-revolving borrowing, which includes student & automobile loans, was accompanied by the first gain in revolving credit in 3 months. Consumers took advantage of declining interest rates to buy vehicles, while higher gasoline prices helped push up the value of their credit-card borrowing. At the same time, job gains may be giving households enough confidence to spend. Non-revolving debt, such as that for college tuition & the purchase of vehicles & mobile homes, rose $13.9B. Demand for automobiles remains an area of strength for the economy. Banks are charging consumers the lowest interest rates on new-car loans since the FED began surveying them in 1971.
U.S. Consumer Credit Jumps $18.12 Billion in August, Fed Says
The federal gov logged a $1.1T deficit in FY2012, the 4th straight year of trillion-dollar shortfalls. As a share of the economy, the deficit fell to roughly 7%, according to Congressional Budget Office (CBO), down from 8.7% in 2011 & well below 10.1% recorded in 2009 during the depth of the economic downturn. Deficits as a share of GDP in the past 4 years have been the highest since 1947. The decline is largely due to an uptick in revenue. Compared to last year, the federal gov collected 6% more in fiscal 2012, which ended Sep 30. A big reason was the jump in corp tax receipts, which rose a whopping 34%. CBO attributes the increase in large part to a change in tax rules, particularly those that govern how fast companies can write off equipment costs. Individual income tax &payroll tax receipts were also higher, by 3% & 4% respectively. Spending, meanwhile, fell 2%. That decline, however, is due mostly to shifts in the timing of payments. Outlays for Medicaid, unemployment benefits, defense & education programs all fell. Meanwhile, Social Security outlays rose 6%, more than in recent years. Money spent on Medicare increased more slowly than in the preview 2 years, rising 3%. Overall, the 2012 deficit pushed the debt held by the public to another record high. Public debt, $11.3T, almost 73% of GDP, up from 67.7% a year ago. Total national debt, which includes money the Treasury Dept owes to gov trust funds, now tops $16T.
U.S. Deficit Tops $1 Trillion for 4th Year in a Row
Gas at the pump continues high. Crude oil has settled back from nearly $100 three weeks ago. But more disruptions, like the refinery fires, can bring even higher prices. The high for 2012 was $3.93 & the record high 4 years ago was $4.11. High priced gas is not good for the economy.
| Regular | Mid | Premium | Diesel | E85 | **E85 MPG/BTU adjusted price |
|
| Current Avg. | $3.789 | $3.960 | $4.105 | $4.083 | $3.353 | $4.412 |
| Yesterday Avg. | $3.784 | $3.945 | $4.087 | $4.084 | $3.356 | $4.417 |
| Week Ago Avg. | $3.787 | $3.943 | $4.082 | $4.086 | $3.385 | $4.455 |
| Month Ago Avg. | $3.824 | $3.970 | $4.111 | $4.106 | $3.433 | $4.517 |
| Year Ago Avg. | $3.399 | $3.544 | $3.677 | $3.812 | $3.044 | $4.006 |


Markets saw selling in the PM. This unemployment report should have given the Dow a gain of at least 200 with good breadth in the markets. The 7.8% number doesn't tell the whole story. Jobs created was drab which has been the case for 6 months. Now that this report is out of the way, the focus will be on earnings. Alcoa (AA), a Dow stock, starts earnings season on Tues. Analysts are looking for EPS of a penny, down from 15¢ last year. This could be a tough earnings season.
Dow Jones Industrials
Get your favorite symbols' Trend Analysis TODAY!


No comments:
Post a Comment