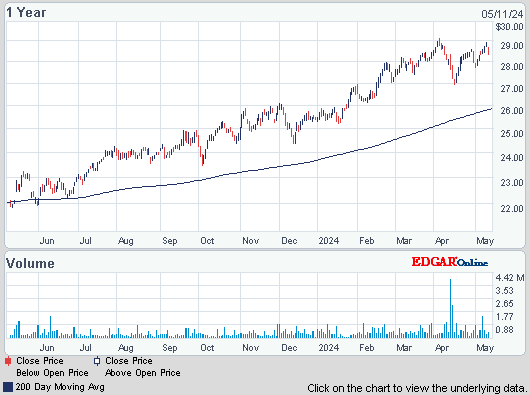
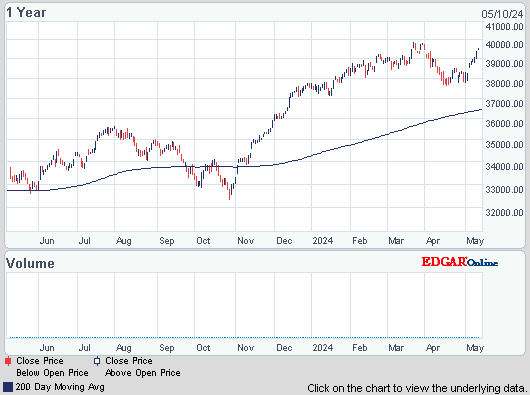
Dow dropped 205, decliners over advancers 4-1 & NAZ fell 67 as tech was weak. The Financial Index slumped 2+ to the 217s (its yearly high). The MLP index dropped 4+ to the 408s & the REIT index slipped 1+ to the 265s. Junk bond funds were mixed & Treasuries rose as stock retreated. Oil was of $2 to just above $90 & gold dropped $22 into the low1700s.
![Live 24 hours gold chart [Kitco Inc.]](http://www.kitco.com/images/live/gold.gif)


Photo: Bloomberg
Sales of previously owned homes in the US decreased in Sep from the highest level in 2 years, restrained by a lack of supply that may keep pushing prices up. Purchases fell 1.7% to a 4.75M annual rate, matching the forecast. The median price from a year earlier jumped by the most since 2005 as inventories dwindled. The number of existing homes for sale is drying up as demand improves, hedge funds snap up foreclosed properties to rent out & owners remain reluctant to sell until prices rise further. Mortgages rates driven to record lows by Federal Reserve stimulus, along with a falling jobless rate, indicate sales will keep improving. The median price of an existing home climbed to $183K, up 11.3 % from Sep 2011, the biggest year- over-year gain since Nov 2005. Compared with a year earlier, purchases increased 11%. The number of previously owned homes on the market dropped 3.3% to 2.32M, the fewest for any Sep since 2002. At the current sales pace, it would take 5.9 months to sell those houses compared with 6 months at the end of August. The month's supply was the lowest since Mar 2006.
Existing U.S. Home Sales Decline as Supply Drop
Photo: Yahoo
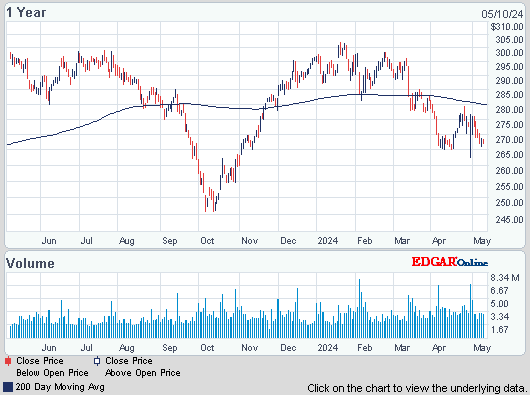
McDonald's, a Dividend Aristocrat, posted its worst quarterly restaurant sales growth performance in 9 years, signaling broad pressure on the industry fighting increased competition. And sales at established restaurants are down so far this month. The results, which underscored how the sluggish US economic recovery, European belt-tightening & cooling growth in China are squeezing even the best-performing restaurant operators. "It's been very rare that we've ever seen all of our major markets experiencing the impact of these kind of global economies at the same time," CEO Don Thompson said. Fast-food chains have overhauled menus to compete with MCD & benefited from lower commodity costs, which have helped them to lower prices. MCD global sales at restaurants open at least 13 months rose 1.9%, the first gain of less than 2% since 2003. Q3 EPS was $1.43, down from $1.45 a year earlier. Foreign- currency exchange-rate fluctuations reduced EPS by 8¢ in Q3. Analysts projected EPS of $1.47. The stock was off a very big $4.07. This is another signal that global economies are sputtering.
McDonald’s Profit Falls 3.5% on Slower Growth at U.S. Stores; Shares Fall
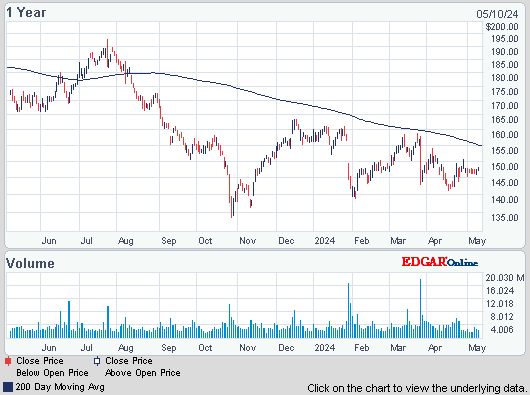
United Parcel Service is expected to offer a subdued view of the global economy when it reports Q3 results before the market opens Tues. 3 months ago, UPS predicted the global economy will get worse before it gets better. Smaller rival FedEx (FDX). said the same last month. Both have also said trade around the world is weak & mimicking trends not seen since the recession. Much of the hardship felt by package delivery companies is due to the sluggish global economy. Shipments out of Asia & into Europe are slowing. Additionally, customers are also opting for slower shipping methods to save money. And gadgets & other electronics, which tend to be shipped by air, are getting lighter. That's dragging down results for air express shipments, traditionally been the most lucrative segment for UPS. As a result, analysts are cutting earnings forecasts for UPS, citing weaker volumes in premium shipping categories & rising fuel costs. As the world's largest package delivery company, UPS offers unique insight into the pace of the global recovery. Because it handles so many consumer & business shipments worldwide, its results may foreshadow broader economic trends. Analysts forecast EPS of $1.06 on revenue of $13.3B (matching last year's results) although UPS expects its earnings will fall under the year-ago period. The stock fell $1.30.
This was another dreary day for the markets, but this time that meant down (not sideways). There is no way around the simple truth that earnings are unsatisfactory. The largest contributor to this week performance is lower sales or only meager sales growth. And this is driven by sluggish economies around the world. Maybe these reports will get more investors to think about the looming fiscal cliff. If if that is resolved, it will be at the last minute with a hodge podge of who knows what. Dow was returned to its Sep 12 level. Since then nothing. Adding insult to injury, Apple (AAPL), with the largest market cap in the world, dropped $21 today & is down $95 from its record high one month ago as it gets ready to launch a new iPad next week.
AMJ (Alerian MLP Index Tracking fund)
Treasury yields:
U.S. 3-month |
0.091% | |
U.S. 2-year |
0.292% | |
U.S. 10-year |
1.766% |
| CLX12.NYM | ...Crude Oil Nov 12..., | 90.76 | ... | (1.5%) |
![Live 24 hours gold chart [Kitco Inc.]](http://www.kitco.com/images/live/gold.gif)


Photo: Bloomberg
Sales of previously owned homes in the US decreased in Sep from the highest level in 2 years, restrained by a lack of supply that may keep pushing prices up. Purchases fell 1.7% to a 4.75M annual rate, matching the forecast. The median price from a year earlier jumped by the most since 2005 as inventories dwindled. The number of existing homes for sale is drying up as demand improves, hedge funds snap up foreclosed properties to rent out & owners remain reluctant to sell until prices rise further. Mortgages rates driven to record lows by Federal Reserve stimulus, along with a falling jobless rate, indicate sales will keep improving. The median price of an existing home climbed to $183K, up 11.3 % from Sep 2011, the biggest year- over-year gain since Nov 2005. Compared with a year earlier, purchases increased 11%. The number of previously owned homes on the market dropped 3.3% to 2.32M, the fewest for any Sep since 2002. At the current sales pace, it would take 5.9 months to sell those houses compared with 6 months at the end of August. The month's supply was the lowest since Mar 2006.
Existing U.S. Home Sales Decline as Supply Drop
Photo: Yahoo
McDonald's, a Dividend Aristocrat, posted its worst quarterly restaurant sales growth performance in 9 years, signaling broad pressure on the industry fighting increased competition. And sales at established restaurants are down so far this month. The results, which underscored how the sluggish US economic recovery, European belt-tightening & cooling growth in China are squeezing even the best-performing restaurant operators. "It's been very rare that we've ever seen all of our major markets experiencing the impact of these kind of global economies at the same time," CEO Don Thompson said. Fast-food chains have overhauled menus to compete with MCD & benefited from lower commodity costs, which have helped them to lower prices. MCD global sales at restaurants open at least 13 months rose 1.9%, the first gain of less than 2% since 2003. Q3 EPS was $1.43, down from $1.45 a year earlier. Foreign- currency exchange-rate fluctuations reduced EPS by 8¢ in Q3. Analysts projected EPS of $1.47. The stock was off a very big $4.07. This is another signal that global economies are sputtering.
McDonald’s Profit Falls 3.5% on Slower Growth at U.S. Stores; Shares Fall
McDonald's (MCD)
United Parcel Service is expected to offer a subdued view of the global economy when it reports Q3 results before the market opens Tues. 3 months ago, UPS predicted the global economy will get worse before it gets better. Smaller rival FedEx (FDX). said the same last month. Both have also said trade around the world is weak & mimicking trends not seen since the recession. Much of the hardship felt by package delivery companies is due to the sluggish global economy. Shipments out of Asia & into Europe are slowing. Additionally, customers are also opting for slower shipping methods to save money. And gadgets & other electronics, which tend to be shipped by air, are getting lighter. That's dragging down results for air express shipments, traditionally been the most lucrative segment for UPS. As a result, analysts are cutting earnings forecasts for UPS, citing weaker volumes in premium shipping categories & rising fuel costs. As the world's largest package delivery company, UPS offers unique insight into the pace of the global recovery. Because it handles so many consumer & business shipments worldwide, its results may foreshadow broader economic trends. Analysts forecast EPS of $1.06 on revenue of $13.3B (matching last year's results) although UPS expects its earnings will fall under the year-ago period. The stock fell $1.30.
UPS (UPS)
This was another dreary day for the markets, but this time that meant down (not sideways). There is no way around the simple truth that earnings are unsatisfactory. The largest contributor to this week performance is lower sales or only meager sales growth. And this is driven by sluggish economies around the world. Maybe these reports will get more investors to think about the looming fiscal cliff. If if that is resolved, it will be at the last minute with a hodge podge of who knows what. Dow was returned to its Sep 12 level. Since then nothing. Adding insult to injury, Apple (AAPL), with the largest market cap in the world, dropped $21 today & is down $95 from its record high one month ago as it gets ready to launch a new iPad next week.




No comments:
Post a Comment