Friday, March 30, 2012

Markets conclude best Q1 since 1998

Dow gained 66, advancers over decliners a mild 3-2 & NAZ slid 3 as Apple fell 10 (going below 600) on concerns about its Chinese worker issues.  The Financial Index went up 1 to 212, near its recent highs.

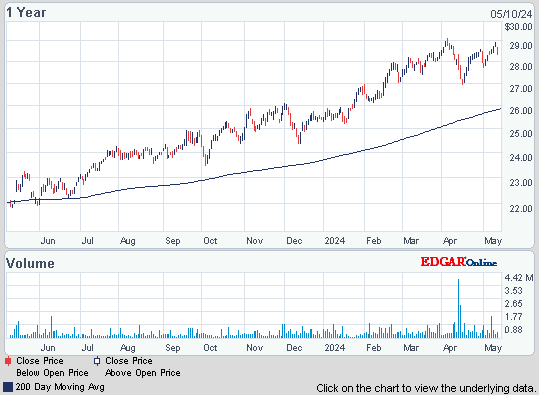
The MLP index rose 3 to 392 & the REIT index was up 2 to 254, a new yearly high.  Junk bond funds were soft while Treasuries sold off in what has been a bad Q1 following a stellar 2011.  Oil climbed, capping a 2nd quarterly gain, after reports showed consumer sentiment & spending rose & the way was cleared for new sanctions targeting Iran.  Gold was up $15, but having a choppy time of it in the last 6 months (see chart below).
JPMorgan Chase Capital XVI (AMJ)


stock chart


Click below for the latest market update:


Treasury yields:

U.S. 3-month

0.066%

U.S. 2-year

0.333%

U.S. 10-year

2.214%

CLK12.NYM...Crude Oil May 12...103.09...Up 0.31  (0.3%)

Live 24 hours gold chart [Kitco Inc.]


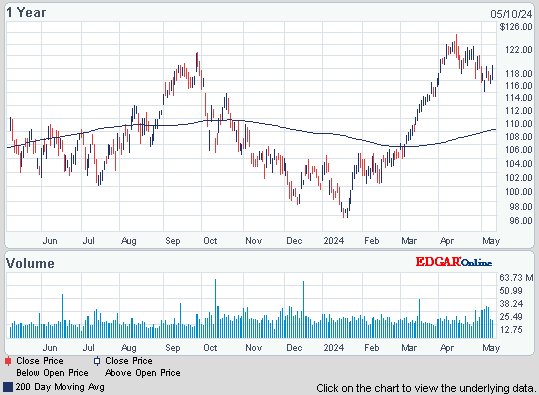
Exxon Mobil, a Dow stock & Dividend Aristocrat, ConocoPhillips (COP) & BP (BP) will produce natural gas condensate from Alaska’s Point Thomson field for delivery over the TransAlaska Pipeline System under an agreement resolving a lawsuit against the state over leases to develop an oil-and gas-rich field.  A new facility will produce 200M cubic feet of gas a day & 10K barrels of condensate a day.  Its completion is scheduled for 2016.  A liquid hydrocarbon pipeline that can move 70K barrels a day is also being designed.  The companies sued Alaska 6 years ago after it revoked their leases, which date back to 1977, for failing to submit an acceptable development plan but a court reversed that decision in 2010.  XOM was up 61¢.
Exxon Mobil Corporation (XOM)


stock chart


Foxconn Audit Finds ‘Serious’ Violations of China Labor Laws

Photo:   Bloomberg

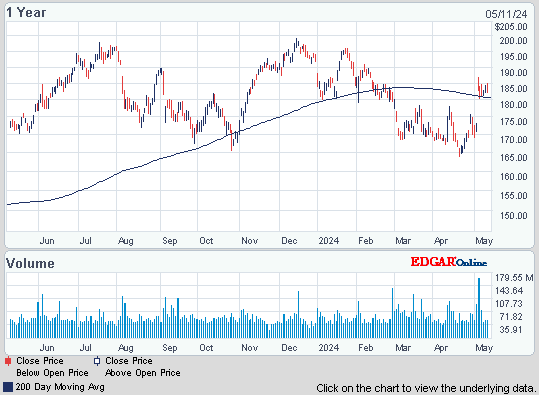
An audit of Foxconn Tech, an Apple (AAPL) supplier, found “serious and pressing” violations of Chinese labor laws, prompting it to pledge to cut working hours & give employees more oversight.   Inspectors found at least 50 breaches of Chinese regulations as well as the code of conduct Apple signed after deaths of workers at suppliers.  Foxconn will bring hours in line with legal limits by Jul 2013 (huh?) & compensate more than 1.2M employees for overtime lost due to the shorter work week.  Assessors found cases of employees working longer hours & more days in a row than allowed.  They uncovered inconsistent health & safety policies & instances of unfair pay for overtime work.  To meet its commitments, Foxconn must hire, train & house tens of thousands of workers to assemble products for AAPL, Dell (DELL), Hewlett-Packard (HPQ & a Dow stock) & other customers.  “We are committed to work with Apple to carry out the remediation program, developed by both our companies,” Foxconn said.  “Our success will be judged by future FLA audits and the monitoring of the implementation of the remediation program, by reviews carried out by Apple and other customers and by future employee surveys.”  AAPL said, “We fully support their recommendations.”  “Empowering workers and helping them understand their rights is essential.” 

Apple Supplier Foxconn Found to ‘Seriously’ Violate Labor Law, Audit Says
Apple Inc. (AAPL)


stock chart


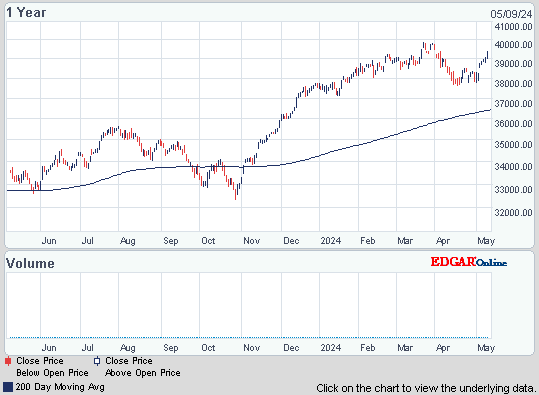
After an excellent Q1, it will be difficult to top that in Q2.  Dow gained just over 1K!!  Because of recent weakness, the Alerian MLP Index lost 1.  That's hardly serious, but MLPs have lost their market leadership role.  The yield on the 10 year Treasury bond rose about 25 basis points from its unbelievability low under 2%.  I am still of the view that the stock markets are every tired & if weakness in AAPL continues, there may be more selling pressure coming to the markets.
Dow Industrials


stock chart


Get your favorite symbols' Trend Analysis TODAY! Click Here


Higher markets as stocks close out Q1

Dow rose 49, advancers ahead of decliners 2-1 but NAZ fell 2 as Apple (AAPL) dropped 7 on worries about its Chinese suppliers.  The Financial Index was up a fraction in the 212s.

The MLP index was flat but the REIT index rose 1 to the 252s (just below its yearly highs).  Junk bond funds were mixed as were Treasuries.  Oil was up a fraction & gold rebounded after recent selling.

JPMorgan Chase Capital XVI (AMJ)


stock chart

Treasury yields:

U.S. 3-month

0.066%

U.S. 2-year

0.333%

U.S. 10-year

2.155%

CLK12.NYM...Crude Oil May 12...103.24.....Up 0.46  (0.5%)

GCJ12.CMX....Gold Apr 12.........1,662.30 ...Up 10.10  (0.6%)


Get the latest daily market update below:


  • <p>               FILE - In this Feb. 28, 2012 file photo, Laurie Hanson looks over clothing at the Adorn clothing store in Montpelier, Vt. U.S. consumers boosted their spending in February by the most in seven months. But Americans' income barely grew, and the saving rate fell to its lowest point in more than two years, according to the Commerce Department, Friday, March 30, 2012. (AP Photo/Toby Talbot, File)
Photo:   Yahoo

Consumers boosted spending in Feb by the most in 7 months.  But income barely grew & the saving rate fell to its lowest point in more than 2 years.  The Commerce Dept said that consumer spending rose 0.8% (ahead of 0.6% forecasted) but income grew 0.2%, matching the weak increase in Jan.  After taking inflation into account, income after taxes fell for a 2nd straight month.  Still, consumers are spending more after the best 3-month hiring stretch in 2 years.  Some of the higher spending reflected surging gas prices.  But consumers also spent more on other goods & services.  Excluding inflation, which was due mainly to gas prices, spending rose 0.5%.  The saving rate dropped to 3.7% of after-tax income, the lowest level since Aug 2009.  The saving rate had been 4.3% in Jan & has averaged 4.7% for all of last year.  More inconclusive news about the economy.

Consumer Spending in U.S. Climbs 0.8%, More Than Forecast


Confidence among consumers unexpectedly rose in Mar for a 7th straight month.  The Thomson Reuters/University of Michigan’s final index of consumer sentiment rose to 76.2, the highest since Feb 2011, from 75.3 in Feb.  A reading of 74.5 was projected after a preliminary Mar figure of 74.3.  Employment & income gains are helping sustain an improvement in confidence that may help lift consumer spending, which accounts for about 70% of the economy.  Estimates for the confidence measure ranged from 72-78.  The index averaged 64.2 during the last recession & averaged 89 in the 5 years before the 18-month economic slump that ended in Jun 2009.

Consumer Sentiment in U.S. Climbed in March to One-Year High


3 of the biggest banks are preparing for fallout from a possible cut in their credit ratings.  Moody's said it will decide in mid-May whether to lower its ratings for 17 global financial companies.   Morgan Stanley (MS)  appears to be the most vulnerable with Moody's threatening to cut its ratings 3 notches (well below the rating of a rival like JPMorgan (JPM).  Bank of America (BAC) & Citigroup (C) may also fall to the same level, but those are helped by having higher-rated subsidiaries.  Credit ratings are important for financial companies, which greatly depend on the confidence of their creditors & the companies they trade with.  A high credit rating enables banks to put up less money, which they can borrow cheaply, while a lower credit rating can mean they have to put up more money & perhaps pay more for their loans.  The 3 banks said that they would have to put up $B more in collateral to back trading contracts. The 3 bank stocks were off only fractionally after having an excellent Q1, rebounding from depressed levels.

Three Major Banks Prepare for Possible Credit Downgrades


Stocks aren't doing a lot as Q1 winds down.  This is shaping up as the best qtr since Q3 2009 & the best Q1 since 1998.  NAZ is also doing well, closing above the important milestone of 3K.  The biggest driver of the gains was that the economy didn't fall apart & the European debt mess was dealt with, postponing long term solutions.  Next Fri will give the big jobs report which will be followed by earnings season (& investors are nervous).

Dow Industrials


stock chart


Get your favorite symbols' Trend Analysis TODAY!  

Thursday, March 29, 2012

Markets drift lower as the quarter winds down

With buying in the PM, Dow was able to break into the black.  Dow finished up 19, decliners ahead of advancers 3-2 & NAZ fell 9 (led by Apple's drop of 8 on worries about its workers' conditions in China).  Bank stocks sold off on Greek debt concerns.  The Financial Index fell 2+ to the 211s (down 4 from its highs on Mon).

There was bargain hunting for MLPs in the PM, but the index was still down 3 to 389.  Even the yearly chart for an ETF tracking the index shows a significant drop in recent weeks.  Junk bond funds were little changed but Treasuries rose.  Oil fell on rumors about oil being released from strategic reserves & gold did not do much. 

JPMorgan Chase Capital XVI (AMJ)


stock chart


Click below for the latest market update:


Treasury yields:

U.S. 3-month

0.061%

U.S. 2-year

0.333%

U.S. 10-year

2.157%

CLK12.NYM...Crude Oil May 12...103.15 ...Down 2.26  (2.1%)

Live 24 hours gold chart [Kitco Inc.]


The US economy grew at a 3% annual rate in Q4, the same as the previous estimate.  But corp profits climbed at the slowest pace in 3 years, suggesting that business investment & hiring will cool.  The increase in GDP was the biggest in more than a year & followed a 1.8% annualized gain in Q3, according to the Commerce Dept.  Company earnings were up 0.9% from Q3, the smallest advance since Q4 2008.  While the report showed business spending on new equipment & software climbed more the previously estimated, figures this month indicate outlays are slowing following the expiration of a gov tax credit.  Consumers may be poised to take a leading role in the expansion as the biggest increase in employment since 2006 gives households the confidence and means to spend.  Companies are likely to remain cautious about hiring & investing in new equipment if growth slows.

Economy in U.S. Grew at 3% Annual Rate in Fourth Quarter


I just came from  meeting with fund managers of prominent high yield funds.  The global economy should expand at a moderate pace.  They are optimistic about junk bonds over the next year even though a few marginal junk bonds have come to market in recent weeks.  The yields are around 7-8%, near record low levels.  But low levels have lasted for long periods in the past.  In addition, the spread over the 10 year Treasury is around 600 basis points, above the 450 spread which has been associated with market tops for junk bonds.


Another reminder about the price of gas.  While it may level off  if crude settles back, it remains in dangerously high territory which will squeeze consumer budgets.

National Unleaded Average
Regular Mid Premium Diesel 85 **E85
MPG/BTU
adjusted
price
Current Avg. $3.921 $4.059 $4.190 $4.162 $3.313 $4.360
Yesterday Avg. $3.911 $4.048 $4.178 $4.159 $3.309 $4.355
Week Ago Avg. $3.881 $4.021 $4.151 $4.153 $3.287 $4.326
Month Ago Avg. $3.716 $3.854 $3.986 $4.041 $3.187 $4.194
Year Ago Avg. $3.595 $3.729 $3.861 $3.961 $3.045 $4.007


This may sound like a broken record, the markets are very tired after a stellar run in the last 6 months.  The US economy is looking good, but not great.  China is so-so with an acceptable growth rate around 8%.  But Europe has problems.  Then there's the high prices for gas.  Being the last trading day in Q1, it's difficult to guess where the markets will go.  In addition, the markets are awaiting data data on consumer confidence & spending tomorrow.  Chances are it will lumber along as it has done this week but Dow is up 65 this week.

Dow Industrials


stock chart


Get your favorite symbols' Trend Analysis TODAY!  


Markets fall as gas at the pump reaches 4 year high

Dow dropped 60, decliners over advancers 4-1 & NAZ fell 19 as even Apple (AAPL) dropped from its record high.  MLPs continued falling off.  The index fell 5+ to the 386s (25 below its recent record highs) & the REIT index dropped 2½ to the 249s.  Junk bond funds inched higher & Treasuries gained as the stock market fell.  Oil declined as France said govs are moving closer to an agreement on a release of barrels from emergency stockpiles to curb price gains.  Gold hardly budged.

JPMorgan Chase Capital XVI (AMJ)


stock chart

Treasury yields:

U.S. 3-month

0.066%

U.S. 2-year

0.329%

U.S. 10-year

2.153%

CLK12.NYM...Crude Oil May 12...104.18 ...Down 1.23  (1.2%)

GCJ12.CMX....Gold Apr 12.........1,659.70 ...Up 1.80  (0.1%)


Get the latest daily market update below:


U.S. Jobless Claims Fell Last Week to Lowest Since April 2008

Photo:   Bloomberg

The number seeking unemployment benefits dropped last week to the lowest level in 4 years.  Applications for unemployment benefits fell 5K to 359K according to the Labor Dept, the fewest since Apr 2008.  The 4-week average declined to 365K, the lowest since May 2008.  The department made annual revisions to the past 5 years of data, which increased the number of applications in recent months & showed a slower decline.  Still, even after revisions, applications have fallen 12% over the past 6 months.  Another strong month of hiring is expected in Mar.  The number receiving unemployment benefits also fell.  More than 7.1M received unemployment aid in the latest week, about 130K lower than the previous week. 

Jobless Claims in U.S. Decline to Lowest Since April 2008


Best Buy Profit Tops Estimates as Company Plans 50 Closings

Photo:   Bloomberg

Best Buy will close 50 big box locations in the US while it launches 100 new mobile locations as it retools its domestic store format.  The Q4 report sharply beat expectations on the bottom line.  In Q4, revenue grew 3% to $16.6B  while EPS hit $2.47.  However expectations were for revenue of $17.15B.  Q4 also benefited from an extra week in the company's fiscal calendar (exceeding the week would mean revenue fell 1.1%).  Same-store sales declined 2.3% during the period.  BBY saw weakness across the board, with sales suffering in gaming, notebooks, digital imaging & TVs.  CEO Dunn said the company would vastly alter its strategy from its long time big box format to boost returns.  "These changes will also help lower our overall cost structure," Dunn said.  "We intend to invest some of these cost savings into offering new and improved customer experiences and competitive prices — which will help drive revenue. And, over time, we expect some of the savings will fall to the bottom line."  It's targeting more than $800M in cost savings by 2015, largely expected through layoffs & store closings.  The targets are roughly split between corp, retail & declines in costs of goods sold.  The company will layoff 400 within its management & support channels (increasing jobless claims).  The stock dropped $1.99 (7%).

Best Buy Closing 50 Large Stores After Fourth-Quarter Sales Miss Estimates

Best Buy Co., Inc. (BBY)


stock chart


Gas at the pump went over $3.91, nearing last year's record & closing in on the $4.11 all time record.

12onth Average
State's Graph
Source:   AAA


With a lack of exciting news, markets sold off.  Jobless claims numbers are good, but that was expected.  The drop in MLPs is sort of leading the market lower (after being a leader on the upside).  Dow is down 20 this week & up only 108 in Mar.  Of course, too much should not be read into the numbers.  We are going into the end of Q1 & all kind of distortions are possible from actions by fund managers.

Dow Industrials


stock chart


Get your favorite symbols' Trend Analysis TODAY!