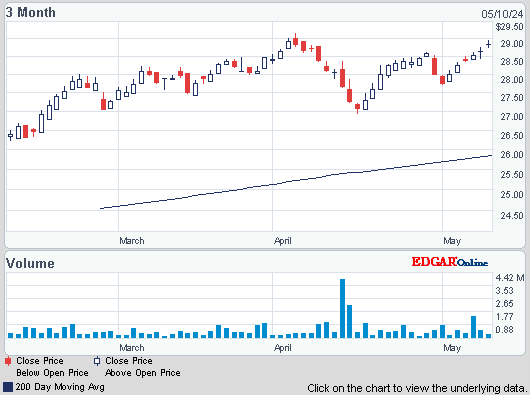
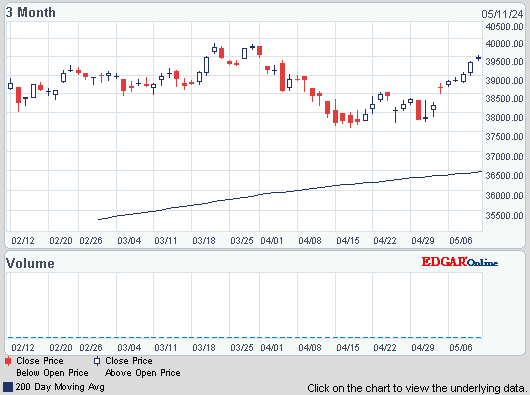
Dow increased 86, advancers over decliners 2-1 & NAZ added 9. The Financial Index went up a fraction to 245. The MLP index was fractionally higher to 449 & the REIT index added 1 to the 284s (essentially matching its post 2008 highs). Junk bond funds gained & Treasuries were flattish. Oil went up on strength in the stock market & gold is back below 1600.
AMJ (Alerian MLP Index tracking fund)


Photo: Bloomberg
A surge in commercial aircraft demand pushed orders for US long-lasting manufactured goods up sharply in Feb. It offset a steep drop in orders that signal company investment plans, although that decline as a temporary setback. Overall orders for durable goods surged 5.7% from Jan, according to the Commerce Dept, the biggest monthly increase in 5 months. But a rebound in volatile commercial aircraft orders drove the gain, up 95% after a 24% drop in Jan. Orders for motor vehicles & parts rose 3.8%, the best showing since Jul. Excluding the transportation sector, orders were down 0.5%. Core capital goods, which strip out volatile aircraft & defense orders, provide a better indication of the trend in business investment. Those orders declined 2.7% from Jan. Demand weakened for machinery & communications equipment, but rose for computers. Still, the decline followed a 6.7% surge in Jan, the biggest one-month gain in nearly 3 years. Prior to the Feb decline, the category had risen in 3 of the previous 4 months.
Orders for U.S. Durable Goods Rise More Than Forecast
Americans are less confident in the economy than they were last month as massive gov spending cuts have stoked economic uncertainty. The Conference Board said its reading of confidence fell in Mar after rebounding last month. The index is closely watched because it makes a monthly gauge of how Americans are feeling about their jobs, incomes & other bread-and-butter issues. Consumer spending accounts for 70% of US economic activity. The Mar confidence index fell to 59.7 from a revised reading of 68 in Feb & is also below the 68.7 reading that was expected. Anxiety about $85B in across-the-board gov spending cuts that took effect Mar 1 caused the decline.
Consumer Confidence in U.S. Declined More Than Forecast in March

Photo: Bloomberg
Sales of new homes dropped to an annual rate of 411K in Feb, according to the Commerce Dept, a decline of 4.6% from the Jan level of 431K (the strongest sales pace since Sep 2008). The decline in Feb still left sales 12.3% higher than a year ago. While sales remain far below the 700K level considered healthy, the housing recovery is gaining strength & is starting to look sustainable. Steady job creation & near record-low mortgage rates are spurring sales. The median price of a new home sold was $246K, up 2.9% from a year ago. Last week, the National Association of Realtors reported that sales of previously owned homes rose 0.8% in Feb to an annual rate of 4.98M, the fastest sales pace since Nov 2009 when a temporary home buyer tax credit had boosted sales. The rise in demand is helping to boost sales and prices in most markets. The increase is a hopeful sign that more homeowners are gaining confidence in the housing recovery & becoming willing to put their homes up for sale, helping to alleviate an inventory squeeze which had held back sales in many markets. Low inventories are just one of several constraints. First-time home buyers are viewed as critical to any sustainable housing recovery, but their numbers are still below healthy levels (making up 30% of existing home sales in Feb, still well below the 40% pace in a healthy market).
February Sales of New U.S. Homes Cap Best Two Months Since 2008February Sales of New U.S. Homes Cap Best Two Months Since 2008
Dow is flirting with a new record high even though economic data was drab. Consumer confidence is the most important because that reflects what's going on. New orders data fluctuates & is sending a fuzzy message while new homes data is more of the same. But bulls want to take control of the markets again after Dow has not been able to make progress since Mar 14. Cyprus was a reminder that the euro debt mess has not gone away & the US economy seems to be stumbling. Earnings season will show how much damage companies suffered from the fiscal mess in DC.
Dow Jones Industrials

AMJ (Alerian MLP Index tracking fund)
Treasury yields:
U.S. 3-month |
0.063% | |
U.S. 2-year |
0.252% | |
U.S. 10-year |
1.931% |
| CLK13.NYM | ...Crude Oil May 13 | ...95.70 | ... | (0.9%) |
| GCH13.CMX | ...Gold Mar 13 | ......1,596.10 | ... | (0.5%) |

Photo: Bloomberg
A surge in commercial aircraft demand pushed orders for US long-lasting manufactured goods up sharply in Feb. It offset a steep drop in orders that signal company investment plans, although that decline as a temporary setback. Overall orders for durable goods surged 5.7% from Jan, according to the Commerce Dept, the biggest monthly increase in 5 months. But a rebound in volatile commercial aircraft orders drove the gain, up 95% after a 24% drop in Jan. Orders for motor vehicles & parts rose 3.8%, the best showing since Jul. Excluding the transportation sector, orders were down 0.5%. Core capital goods, which strip out volatile aircraft & defense orders, provide a better indication of the trend in business investment. Those orders declined 2.7% from Jan. Demand weakened for machinery & communications equipment, but rose for computers. Still, the decline followed a 6.7% surge in Jan, the biggest one-month gain in nearly 3 years. Prior to the Feb decline, the category had risen in 3 of the previous 4 months.
Orders for U.S. Durable Goods Rise More Than Forecast
Americans are less confident in the economy than they were last month as massive gov spending cuts have stoked economic uncertainty. The Conference Board said its reading of confidence fell in Mar after rebounding last month. The index is closely watched because it makes a monthly gauge of how Americans are feeling about their jobs, incomes & other bread-and-butter issues. Consumer spending accounts for 70% of US economic activity. The Mar confidence index fell to 59.7 from a revised reading of 68 in Feb & is also below the 68.7 reading that was expected. Anxiety about $85B in across-the-board gov spending cuts that took effect Mar 1 caused the decline.
Consumer Confidence in U.S. Declined More Than Forecast in March

Photo: Bloomberg
Sales of new homes dropped to an annual rate of 411K in Feb, according to the Commerce Dept, a decline of 4.6% from the Jan level of 431K (the strongest sales pace since Sep 2008). The decline in Feb still left sales 12.3% higher than a year ago. While sales remain far below the 700K level considered healthy, the housing recovery is gaining strength & is starting to look sustainable. Steady job creation & near record-low mortgage rates are spurring sales. The median price of a new home sold was $246K, up 2.9% from a year ago. Last week, the National Association of Realtors reported that sales of previously owned homes rose 0.8% in Feb to an annual rate of 4.98M, the fastest sales pace since Nov 2009 when a temporary home buyer tax credit had boosted sales. The rise in demand is helping to boost sales and prices in most markets. The increase is a hopeful sign that more homeowners are gaining confidence in the housing recovery & becoming willing to put their homes up for sale, helping to alleviate an inventory squeeze which had held back sales in many markets. Low inventories are just one of several constraints. First-time home buyers are viewed as critical to any sustainable housing recovery, but their numbers are still below healthy levels (making up 30% of existing home sales in Feb, still well below the 40% pace in a healthy market).
February Sales of New U.S. Homes Cap Best Two Months Since 2008February Sales of New U.S. Homes Cap Best Two Months Since 2008
Dow is flirting with a new record high even though economic data was drab. Consumer confidence is the most important because that reflects what's going on. New orders data fluctuates & is sending a fuzzy message while new homes data is more of the same. But bulls want to take control of the markets again after Dow has not been able to make progress since Mar 14. Cyprus was a reminder that the euro debt mess has not gone away & the US economy seems to be stumbling. Earnings season will show how much damage companies suffered from the fiscal mess in DC.
Dow Jones Industrials


1 comment:
The housing market seems to be improving
Post a Comment