This blog gives investors more financial information for very smart investing!
Tuesday, September 1, 2015
Markets tumble on weak manufacturing data in the US and China
Dow sank 360, decliners over advancers a big 7-1 & NAZ fell 81. The MLP index dropped 6+ to the 352s & the REIT index lost 2+ to the 296s. Junk bond funds were mixed & Treasuries rose. Oil had profit taking (see below) & gold went higher.
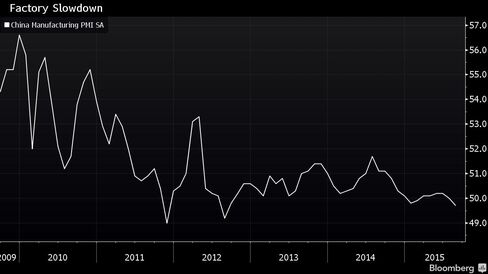
China’s official factory gauge fell to the lowest level in 3
years as monetary easing failed to revive old growth drivers, while
measures for the euro area signaled a divergence in the German &
French economies. China’s official Purchasing Managers’ Index was
49.7 for Aug, matching the estimate &
down from 50 in Jul. Numbers below 50 indicate contraction, with small,
medium & large enterprises all below that level last month. A similar
gauge for France fell to 48.3 from 49.6, while the German reading rose
more than estimated to 53.3, according to Markit
Economics.
The
PMI data highlight the headwinds faced by the global economy, with the
euro-area recovery remaining fragile & France’s struggle leaving
Germany carrying more of the region’s burden. The overall euro-area
measure was at 52.3 in Aug, below the initial reading of 52.4. A
gauge of new orders rose to the highest in more than a year, while
export demand also improved. UK
manufacturing growth cooled in Aug as export orders fell for a 5th
month. In its monthly factory report, Markit said
companies blamed the decline in foreign demand on the strong £, weak
sales in the euro area & the Chinese economic slowdown. The headline
manufacturing index slipped to 51.5 from 51.9 in Jul. The People’s Bank of China last week
lowered benchmark interest rates for the 5th time since Nov &
allowed the yuan to devalue on Aug 11 in a move that should help
bolster exports. With deepening factory gate deflation & sluggish
external demand outside of the US market, manufacturers have yet to
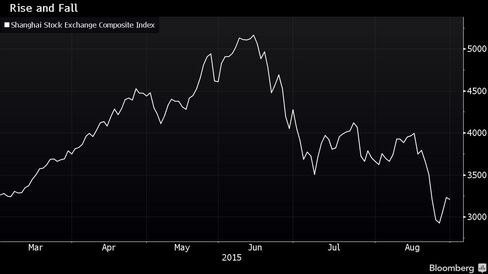
show a sustained response to the monetary easing. The Shanghai Composite Index slid 1.2% to 3166.
The PBOC caused a stir in global markets by allowing
the biggest yuan depreciation in 2 decades on Aug 11, when it changed
the exchange-rate mechanism to give markets a bigger role in setting
the currency’s level. To fend off depreciation, the central bank has
intervened in the onshore market.\
US manufacturing expanded in Aug at the slowest pace
since May 2013 as anemic demand from emerging markets such as China
translated into leaner factory order books. The Institute for Supply Management’s index fell to 51.1, lower than
the estimate, from 52.7 in Jul. A measure of exports matched the
weakest reading since Apr 2009. The dollar’s ascent, which has accelerated since the middle of last
year, is making it tougher for US producers to drum up overseas sales,
prompting plants to slow hiring & production. While factories are
finding some relief with robust car sales & a recent rebound in
investment in new equipment, record inventory building in H1 is an added hurdle. Weak data for manufacturing surface ahead of the Fed's Sep policy meeting. The US gauge is hovering above
the reading of 50 that is the dividing line between expansion &
contraction in the industries that make up 12% of the
economy. The forecast called for 52.5 in
Aug. The new orders gauge dropped to a more than 2-year low
of 51.7 from 56.5 the prior month. It marked the biggest decline since
Jan, when shaky overseas economies & weaker business investment
tied to a slowdown in the nation’s oil patch held factories back. A measure of export orders decreased by 1.5 points to 46.5 in Aug,
matching Jul 2012 as the lowest level since the depths of the
recession. The gauge has been in expansionary territory just once this
year. Global economic malaise is prompting
factory managers to slow the pace of hiring. The ISM’s employment index
declined to a 4-month low of 51.2 from 52.7. The report also showed the slowest rate of production growth since
Feb 2014 as factories work off inventories, which shrank for a 2nd month.
Oil prices fell sharply after official data showed China's
manufacturing sector, one of the main engines powering the world's
biggest energy consumer, contracted at its fastest pace in 3 years. The figures helped spur a retreat in oil prices after 3 days of
hefty gains. Investors took profits after Brent & US crude both
soared more than 8% yesterday. Figures from the Energy Information Administration (EIA) on Mon
showed US oil output peaked at just above 9.6M barrels per day
(bpd) in Apr before falling more than 300K bpd over the
following 2 months. But the global market is still heavily oversupplied. Oil producers in OPEC are pumping over 2M bpd more than required, forecasters
say, filling oil stockpiles worldwide.
The new month begins with gloomy economic data around the globe. The best case scenario for the bulls is this could give pause at the Fed when they talk about raising interest rates in 2 weeks. The other side of the coin is that gloomy economic news is just plain gloomy & does not support a market advance.


No comments:
Post a Comment