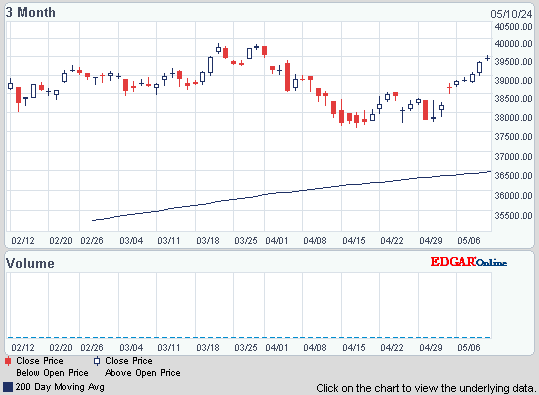
Stocks are losing steam after a strong opening. Dow is up 27, decliners barely ahead of advancers & NAZ fell 27 (hurt by a dreary report form Amazon). Bank stocks are higher, but the Financial Index is taking a pause after unsuccessfully trying to top its interim highs of 181 last week.
The MLP index rose 2 to the 368s while the REIT index fell a fraction to 221. Junk bond funds were about 1% higher & Treasuries inched higher. The VIX, volatility index, went up 1 to the 33s on greater nervousness about stocks. Oil extended losses after the Energy Dept said stockpiles gained 4.74B barrels last week. Gold is hot again on increased worries over the European debt mess.


Photo: Yahoo
Demand for a range of long- lasting US manufactured goods rose more than expected in Sep, the largest increase in 6 months. The Commerce Dept said durable goods orders (excluding transportation) rose 1.7% after falling 0.4% in Aug, beating expectations for a 0.4% increase. But a drop in transportation equipment, as bookings for motor vehicles & civilian aircraft declined, pulled down overall orders 0.8%, following a 0.1% dip in Aug (in line with expectations for a 0.9% fall). Transportation orders fell 7.5%, the largest decline since Apr. The report was further strengthened by a 2.4% jump in non-defense capital goods orders excluding aircraft (closely watched as a proxy for business spending), the largest increase since Mar. That category increased 0.5% in Aug & last month's increase was well above expectations for a 0.5% rise. The report was additional evidence that economic activity picked up in Q3 after a weak H1. Though manufacturing slowed in recent months, the durable goods report points to underlying resilience.

Sales of new homes in the US rose in Sep after 4 monthly declines, largely because builders cut their prices. The Commerce Dept said that sales rose 5.7% to an annual rate of 313K homes. But that's less than half the 700K that must be sold to sustain a healthy housing market. A big reason for the gain was that the median sales price fell 3.1% to $204K, the lowest in a year. The number of new homes on the market was also unchanged at 163K, a record low. While new homes represent less than 20% of the housing market, they have an outsize impact on the economy as each home built creates an average of 3 jobs for a year & generates about $90K in taxes. Last year was also the 5th straight year that sales of have fallen, following 5 straight years of record highs when housing was booming. Home builders started projects in Sep at the fastest pace in 17 months, a hopeful sign. But most of the gain was driven by a surge in volatile apartment construction, a sign that many are choosing to rent rather than own a home. Single-family home construction, 70% of homes built, rose only slightly. Building permits, a gauge of future construction, fell to a 5-month low. Housing data continues to be dismal.
Sales of New U.S. Homes Hits Five-Month High
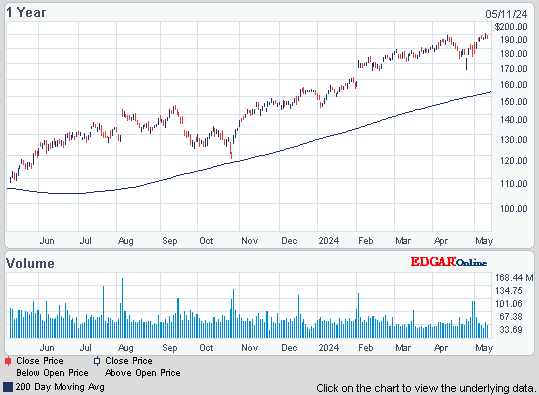
Boeing, a Dow stock, posted larger Q3 profits, topping forecasts, on strong commercial & military sales. In addition, the company raised earnings forecast for 2011. BA recently began making deliveries of 787 Dreamliners & 747-8 Freighters, 2 of its highest-profile airplanes, which are years behind schedule. Q3 EPS rose to $1.46 from $1.12 last year beating the earnings forecast of $1.10. For the full year, EPS guidance was raised to $4.30-$4.40, "reflecting strong core performance." Its previous forecast was $3.90-$4.10. The company, however, narrowed its 2011 revenue forecast to $68-$70B, from $68-$71B previously. The stock rose 2.31 (4%).
Boeing Beats Quarterly Profit Estimate, Spreads 787 Costs Over 1,100 Jets

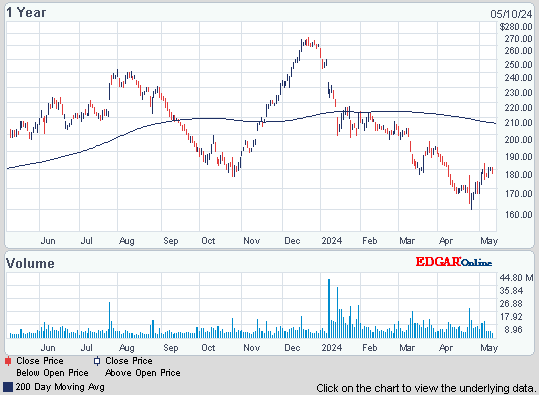
Amazon shocked everybody with a far weaker-than-expected outlook for the crucial holiday season qtr as it spent heavily on its new Kindle Fire tablet computer. The stock tumbled on concern that AMZN was losing some of the revenue momentum. It forecast Q4 revenue of $16.34-$18.65B, weak compared with the average estimate of $18.15B. This forecast suggests 27-44% growth from a year earlier. In Q3, sales grew 44%, less than the 51% gain in Q2. AMZN said it could report a $200M operating loss to a $250M operating profit in the holiday quarter as it spends on the Fire & other initiatives. That forecast was "materially" below expectations. Q3 EPS was 14¢ versus 51¢ a year earlier. Revenue was $10.88B, up 44% from Q3 2010. Expectations were for EPS of 24¢ on revenue of $10.95. The high flying stock plunged 25 (11%).
Amazon Profit Plunges After New Products Increase Expenses; Shares Tumble

One headline is France & Germany come closer to a bailout fund deal. The picture below shows a happy couple, but I don't know. Being real, there are major differences, especially about the haircuts (loan loosses) financial institutions will have to take on Greek debt. The situation remains fluid & noboy knows where this will lead. The VIX rose. Earnings continue mixed, but the AMZN data could be telling for other stocks. The markets look like they are stumbling, maybe rethinking the Oct rally.
Photo: Yahoo

S&P 500 Financials Sector Index
| Value | 175.65 | |
| Change | 0.78 (0.4%) |
The MLP index rose 2 to the 368s while the REIT index fell a fraction to 221. Junk bond funds were about 1% higher & Treasuries inched higher. The VIX, volatility index, went up 1 to the 33s on greater nervousness about stocks. Oil extended losses after the Energy Dept said stockpiles gained 4.74B barrels last week. Gold is hot again on increased worries over the European debt mess.
ALERIAN MLP Index (^AMZ)
DJ REIT INDEXDJR (^DJR)
Treasury yields:
U.S. 3-month | 0.015% | |
U.S. 2-year | 0.281% | |
U.S. 10-year | 2.162% |
| CLZ11.NYM | ....Crude Oil Dec 11 | ...91.96 | ... | (1.3%) |
| GCV11.CMX | ...Gold Oct 11 | ......1,709.30 | ... | (0.6%) |
Click below for the latest market update:
Photo: Yahoo
Demand for a range of long- lasting US manufactured goods rose more than expected in Sep, the largest increase in 6 months. The Commerce Dept said durable goods orders (excluding transportation) rose 1.7% after falling 0.4% in Aug, beating expectations for a 0.4% increase. But a drop in transportation equipment, as bookings for motor vehicles & civilian aircraft declined, pulled down overall orders 0.8%, following a 0.1% dip in Aug (in line with expectations for a 0.9% fall). Transportation orders fell 7.5%, the largest decline since Apr. The report was further strengthened by a 2.4% jump in non-defense capital goods orders excluding aircraft (closely watched as a proxy for business spending), the largest increase since Mar. That category increased 0.5% in Aug & last month's increase was well above expectations for a 0.5% rise. The report was additional evidence that economic activity picked up in Q3 after a weak H1. Though manufacturing slowed in recent months, the durable goods report points to underlying resilience.

Photo: Bloomberg
Sales of new homes in the US rose in Sep after 4 monthly declines, largely because builders cut their prices. The Commerce Dept said that sales rose 5.7% to an annual rate of 313K homes. But that's less than half the 700K that must be sold to sustain a healthy housing market. A big reason for the gain was that the median sales price fell 3.1% to $204K, the lowest in a year. The number of new homes on the market was also unchanged at 163K, a record low. While new homes represent less than 20% of the housing market, they have an outsize impact on the economy as each home built creates an average of 3 jobs for a year & generates about $90K in taxes. Last year was also the 5th straight year that sales of have fallen, following 5 straight years of record highs when housing was booming. Home builders started projects in Sep at the fastest pace in 17 months, a hopeful sign. But most of the gain was driven by a surge in volatile apartment construction, a sign that many are choosing to rent rather than own a home. Single-family home construction, 70% of homes built, rose only slightly. Building permits, a gauge of future construction, fell to a 5-month low. Housing data continues to be dismal.
Sales of New U.S. Homes Hits Five-Month High
Boeing, a Dow stock, posted larger Q3 profits, topping forecasts, on strong commercial & military sales. In addition, the company raised earnings forecast for 2011. BA recently began making deliveries of 787 Dreamliners & 747-8 Freighters, 2 of its highest-profile airplanes, which are years behind schedule. Q3 EPS rose to $1.46 from $1.12 last year beating the earnings forecast of $1.10. For the full year, EPS guidance was raised to $4.30-$4.40, "reflecting strong core performance." Its previous forecast was $3.90-$4.10. The company, however, narrowed its 2011 revenue forecast to $68-$70B, from $68-$71B previously. The stock rose 2.31 (4%).
Boeing Beats Quarterly Profit Estimate, Spreads 787 Costs Over 1,100 Jets
Boeing Company (The) (BA)
Amazon shocked everybody with a far weaker-than-expected outlook for the crucial holiday season qtr as it spent heavily on its new Kindle Fire tablet computer. The stock tumbled on concern that AMZN was losing some of the revenue momentum. It forecast Q4 revenue of $16.34-$18.65B, weak compared with the average estimate of $18.15B. This forecast suggests 27-44% growth from a year earlier. In Q3, sales grew 44%, less than the 51% gain in Q2. AMZN said it could report a $200M operating loss to a $250M operating profit in the holiday quarter as it spends on the Fire & other initiatives. That forecast was "materially" below expectations. Q3 EPS was 14¢ versus 51¢ a year earlier. Revenue was $10.88B, up 44% from Q3 2010. Expectations were for EPS of 24¢ on revenue of $10.95. The high flying stock plunged 25 (11%).
Amazon Profit Plunges After New Products Increase Expenses; Shares Tumble
Amazon.com, Inc. (AMZN)
One headline is France & Germany come closer to a bailout fund deal. The picture below shows a happy couple, but I don't know. Being real, there are major differences, especially about the haircuts (loan loosses) financial institutions will have to take on Greek debt. The situation remains fluid & noboy knows where this will lead. The VIX rose. Earnings continue mixed, but the AMZN data could be telling for other stocks. The markets look like they are stumbling, maybe rethinking the Oct rally.
Photo: Yahoo
Dow Industrials (INDU)
Get your favorite symbols' Trend Analysis TODAY!


No comments:
Post a Comment